This post is part of a series that examines the composite indicators of the EU Digital Decade. Previously, I explored the Digital Intensity Index, which measures the digital transformation of businesses. This time, the focus is on the Digital Skills Indicator (DSI), one of key performance indicators in the context of the Digital Decade.
The goal of this analysis is to improve our understanding of the current state of digital competencies within the EU population and to evaluate the progress made in 2023 compared to 2021. First, I will provide an overview of composite indicators and introduce the DSI. Then, I will use data from Eurostat to conduct an exploratory data analysis of the DSI components and share key insights from the analysis.
Introducing Digital Skills Indicator
In this section, I introduce the Digital Skills Indicator, a composite measure used to assess the digital competencies of individuals across the EU.
First, I will introduce indicators. Indicators are tools used across various fields, such as economics, education, health, and environmental science, to monitor changes, trends, or conditions. You might already be familiar with key performance indicators (KPIs), which are quantitative or qualitative measures used to track progress toward specific goals. However, when addressing complex, multi-dimensional issues, relying on individual indicators alone may not be enough. This is where composite indicators come into play.
Composite indicators
Composite indicators aggregate multiple individual indicators into a single, comprehensive measure, offering a summarized view of complex phenomena. For instance, the Human Development Index (HDI) combines indicators like life expectancy, education level, and income to measure a country’s overall development.
Creating a composite indicator involves several steps: selecting relevant individual indicators, normalizing them (especially when they are on different scales), assigning weights based on their importance, and then aggregating them into a final score. The primary purpose of composite indicators is to simplify complex data, making it easier to interpret, compare, and communicate findings, particularly in broad, multi-dimensional contexts.
Digital Skills Indicator
The Digital Skills Indicator (DSI) is essential for monitoring the EU’s progress towards its Digital Decade goals. Specifically, the 2030 target is that at least 80% of citizens aged 16-74 have at least basic digital skills.
The DSI is a composite indicator derived from surveys on ICT (Information and Communication Technology) use in households and by individuals. It assesses five key areas: information and data literacy, communication and collaboration, digital content creation, safety, and problem-solving. The assumption is that individuals who perform specific digital activities possess the corresponding skills. To be classified as having at least basic digital skills, individuals must demonstrate competence in at least one activity in each of these areas.
For detailed information on DSI levels and the activities related to each skill, Eurostat provides comprehensive metadata.
Why Understanding Digital Skills Data Matters
In today’s digital world, possessing digital skills is a necessity. Understanding DSI data is essential as it provides insights into the current state of digital competencies within the EU population. This data is vital for policymakers, educators, businesses, and individuals to identify areas where digital skills are lacking, target interventions, and monitor progress toward digital literacy goals. Staying informed about digital skills data ensures that societies can effectively participate in the digital economy, foster innovation, and close the digital divide.
Exploratory Data Analysis
Exploratory Data Analysis (EDA) focuses on understanding DSI data, identifying patterns, and generating hypotheses for further analysis. This involves visualizing data, calculating summary statistics, and identifying trends and relationships among variables.
The key question guiding this analysis is: What do the distributions of the Digital Skills Indicator components for 2021 and 2023 reveal about the overall shifts in digital skills across the EU population?
Data Collection
The data analyzed is sourced from Eurostat’s database on individuals’ digital skills.
The analysis uses several packages, including eurostat1 for data retrieval, tidyverse2 for data manipulation and visualization, janitor3 for data cleaning, reactable4 for interactive tables and patchwork5 for plot composition.
Packages
Download data
Show the code
# Search for the data set
search_results <- search_eurostat("isoc_sk_dskl_i21", column = "code")

id <- search_results$code[1]

# Retrieve data
dat <- get_eurostat(id,
                    time_format = "num",
                    type = "label",
                    stringsAsFactors = TRUE)
indexed 0B in  0s, 0B/s
indexed 2.15GB in  0s, 2.15GB/s
Show the code
# Inspect the structure of the data set
glimpse(dat)
Rows: 397,473
Columns: 7
$ freq <fct> Annual, Annual, Annual, Annual, Annual, Annual, Annual, An…
$ ind_type <fct> "Individuals who are born in another EU Member State", "In…
$ indic_is <fct> "Individuals with above basic overall digital skills (all …
$ unit <fct> Percentage of individuals, Percentage of individuals, Perc…
$ geo <fct> "Austria", "Austria", "Belgium", "Belgium", "Bulgaria", "B…
$ TIME_PERIOD <dbl> 2021, 2023, 2021, 2023, 2021, 2023, 2021, 2023, 2021, 2023…
$ values <dbl> 42.73, 37.81, 35.50, 34.31, NA, 24.99, 7.34, 16.67, 30.24,…Explore data set
Show the code
skimr::skim(dat)| Name | dat |
| Number of rows | 397473 |
| Number of columns | 7 |
| _______________________ | |
| Column type frequency: | |
| factor | 5 |
| numeric | 2 |
| ________________________ | |
| Group variables | None |
Variable type: factor
| skim_variable | n_missing | complete_rate | ordered | n_unique | top_counts |
|---|---|---|---|---|---|
| freq | 0 | 1 | FALSE | 1 | Ann: 397473 |
| ind_type | 0 | 1 | FALSE | 126 | Ind: 3476, Fem: 3476, Fem: 3476, Fem: 3476 |
| indic_is | 0 | 1 | FALSE | 24 | Ind: 16924, Ind: 16924, Ind: 16924, Ind: 16924 |
| unit | 0 | 1 | FALSE | 2 | Per: 203038, Per: 194435 |
| geo | 0 | 1 | FALSE | 38 | Spa: 11633, Aus: 11609, Cze: 11562, Est: 11562 |
Variable type: numeric
| skim_variable | n_missing | complete_rate | mean | sd | p0 | p25 | p50 | p75 | p100 | hist |
|---|---|---|---|---|---|---|---|---|---|---|
| TIME_PERIOD | 0 | 1.00 | 2021.97 | 1.00 | 2021 | 2021.00 | 2021.00 | 2023.00 | 2023 | ▇▁▁▁▇ |
| values | 14185 | 0.96 | 42.50 | 34.28 | 0 | 10.97 | 32.22 | 76.74 | 100 | ▇▅▂▂▅ |
The data set contains 397.473 rows and 7 columns. Here are the columns and their data types:
-
freq- factor, representing the frequency of data collection -
ind_type- factor, representing the category of individuals surveyed -
ind_is- factor, representing the specific digital skills indicator -
unit- factor, describing the unit of measure -
geo- factor, representing the country name -
TIME PERIOD- numeric, representing the year of the survey -
values- numeric, representing the actual value of the indicator in percentage
There are 54 ind_type with 14185 missing values. I will keep them as they are, as the data may not exist.
For more detailed information about the data set, refer to metadata on individuals’ level of digital skills.
Data Cleaning
Rename columns
Show the code
Rows: 397,473
Columns: 6
$ year      <fct> 2021, 2023, 2021, 2023, 2021, 2023, 2021, 2023, 2021, 2023, …
$ country   <fct> "Austria", "Austria", "Belgium", "Belgium", "Bulgaria", "Bul…
$ indicator <fct> "Individuals with above basic overall digital skills (all fi…
$ category  <fct> "Individuals who are born in another EU Member State", "Indi…
$ unit      <fct> Percentage of individuals, Percentage of individuals, Percen…
$ value     <dbl> 42.73, 37.81, 35.50, 34.31, NA, 24.99, 7.34, 16.67, 30.24, 3…
Filtering data
The data set is filtered to include the five digital skills areas and overall digital skills, each categorized into three proficiency levels: “Above basic skills,” “Basic skills,” and “Basic or above basic skills (at least basic digital skills).” The analysis focuses on EU member states and the European Union - 27 countries (as of 2020), considering the “percentage of individuals” as a unit and “all individuals” as the category. After filtering data for variables of interest, the data set contains no missing values.
Show the code
digital_skills_filtered <- digital_skills |>
  filter(!indicator %in% c("Individuals with online information and communication skills",
                           "Individuals with limited overall digital skills (two out of five component indicators are at basic or above basic level)",
                           "Individuals with low overall digital skills (four out of five component indicators are at basic or above basic level)",
                           "Individuals with narrow overall digital skills (three out of five component indicators are at basic or above basic level)",
                           "Digital skills could not be assessed because the individual has not used the internet in the last 3 months",
                           "Individuals with no overall digital skills"),
         !country %in% c("Türkiye", "North Macedonia","Montenegro", "Switzerland", "Bosnia and Herzegovina","Euro area (EA11-1999, EA12-2001, EA13-2007, EA15-2008, EA16-2009, EA17-2011, EA18-2014, EA19-2015, EA20-2023)", "Iceland", "Serbia", "Norway", "Albania" ),
         unit == "Percentage of individuals",
         category == "All Individuals") |>
  mutate(value = round(value, 2),
         country = ifelse(country == "European Union - 27 countries (from 2020)", "EU", country)) |>
  select(year, country, indicator, category, unit, value)
Summary Statistics
This section explores the data related to the DSI components using measures of central tendency (mean, median) and measures of spread (minimum, maximum, standard deviation).
Measures of central tendency
Show the code
# Summarize the data
digital_skills_summary <- digital_skills_filtered |>
  filter(country != "EU") |>
  group_by(indicator, year) |>
  summarise(
    mean = round(mean(value, na.rm = TRUE), 2),
    median = round(median(value, na.rm = TRUE), 2),
    count = n(),
    minimum = min(value, na.rm = TRUE),
    maximum = max(value, na.rm = TRUE),
    standard_deviation = round(sd(value, na.rm = TRUE),2)
  ) |>
  ungroup() |>

  # Extract `digital skills` and `indicator level` from the `indicator` column
 mutate(
    digital_skills = case_when(
      str_detect(indicator, "communication and collaboration") ~ "Communication and Collaboration Skills",
      str_detect(indicator, "digital content creation") ~ "Digital Content Creation Skills",
      str_detect(indicator, "information and data literacy") ~ "Information and Data Literacy Skills",
      str_detect(indicator, "overall digital skills") ~ "Overall Digital Skills",
      str_detect(indicator, "problem solving skills") ~ "Problem Solving Skills",
      str_detect(indicator, "safety skills") ~ "Safety Skills"
    ),
    indicator_level = case_when(
      # Special case for overall digital skills with basic level
      str_detect(indicator, "basic overall digital skills \\(all five component indicators are at basic or above basic level, without being all above basic\\)") ~
        "Individuals with basic skills",

      # Other cases using ifelse() to handle the overall digital skills
      str_detect(indicator, "overall digital skills") ~ ifelse(
        str_detect(indicator, "basic or above basic"),
        "Individuals with basic or above basic skills",
        "Individuals with above basic skills"
      ),

      # General cases
      str_detect(indicator, "basic or above basic") ~ "Individuals with basic or above basic skills",
      str_detect(indicator, "above basic") ~ "Individuals with above basic skills",
      str_detect(indicator, "basic") ~ "Individuals with basic skills"
    )
  ) |>
  select(digital_skills, indicator_level, year, mean, median, count, minimum, maximum, standard_deviation)
Show the code
reactable(digital_skills_summary,
          searchable = TRUE,
          showPageInfo = TRUE,
          groupBy = c("digital_skills","year"),
          columnGroups = list(
            colGroup("Indicator", columns = c("digital_skills", "indicator_level")),
            colGroup("Year", columns = "year"),
            colGroup("Summary Statistics", columns = c("mean", "median", "count", "minimum", "maximum", "standard_deviation"))),
          columns = list(digital_skills = colDef(minWidth = 300, defaultSortOrder = "asc"),
                         indicator_level = colDef(minWidth = 300, defaultSortOrder = "asc")),
          defaultSorted = c("digital_skills","indicator_level"),
          resizable = TRUE,
          wrap = FALSE,
          bordered = TRUE
          )
Measures of spread
Filter the data set
Show the code
# Summarize the data
digital_skills_distrib <- digital_skills_filtered |>
  filter(country != "EU") |>
  mutate(
    digital_skills = case_when(
      str_detect(indicator, "communication and collaboration") ~ "Communication and Collaboration Skills",
      str_detect(indicator, "digital content creation") ~ "Digital Content Creation Skills",
      str_detect(indicator, "information and data literacy") ~ "Information and Data Literacy Skills",
      str_detect(indicator, "overall digital skills") ~ "Overall Digital Skills",
      str_detect(indicator, "problem solving skills") ~ "Problem Solving Skills",
      str_detect(indicator, "safety skills") ~ "Safety Skills"
    ),
    indicator_level = case_when(
      # Special case for overall digital skills with basic level
      str_detect(indicator, "basic overall digital skills \\(all five component indicators are at basic or above basic level, without being all above basic\\)") ~
        "Individuals with basic skills",

      # Other cases using ifelse() to handle the overall digital skills
      str_detect(indicator, "overall digital skills") ~ ifelse(
        str_detect(indicator, "basic or above basic"),
        "Individuals with basic or above basic skills",
        "Individuals with above basic skills"
      ),

      # General cases
      str_detect(indicator, "basic or above basic") ~ "Individuals with basic or above basic skills",
      str_detect(indicator, "above basic") ~ "Individuals with above basic skills",
      str_detect(indicator, "basic") ~ "Individuals with basic skills"
    )
  ) |>
  select(year, country, digital_skills, indicator_level, value)
Visualization
The visualizations show the distribution of digital skills by proficiency level across EU countries, divided into three categories: Basic Skills, Above Basic Skills, and Basic or Above Skills. The data is compared between two years, 2021 and 2023, across five skill components :
Communication and Collaboration Skills
Digital Content Creation Skills
Information and Data Literacy Skills
Problem Solving Skills
Safety Skills
and Overall Digital Skills
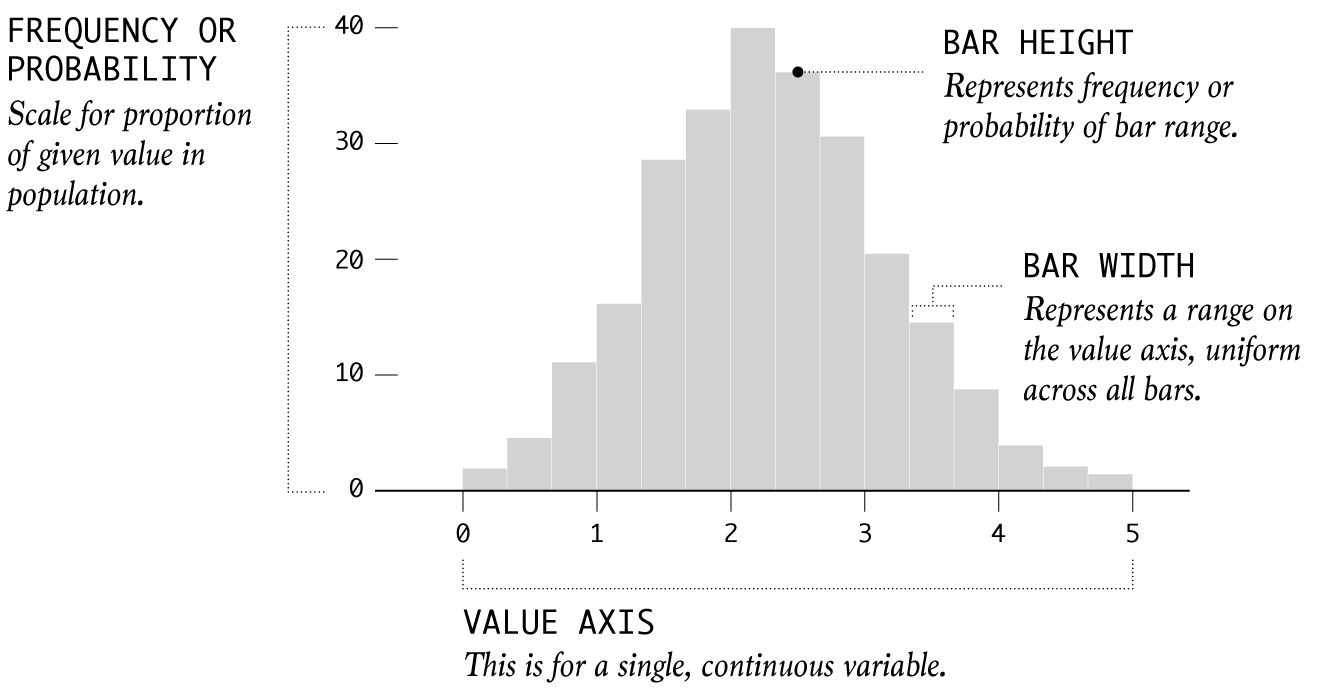
The histograms show the frequency distribution of proficiency levels across EU countries.
Basic Skills: The histograms for basic skills generally show that most EU countries have a low to moderate percentage of individuals with basic digital skills, with some variability between 2021 and 2023. There is a slight shift in distribution between the two years for most components, indicating possible changes in proficiency levels over time.
Above Basic Skills: The histograms for above basic skills show higher proficiency levels. The data for 2023 often shows a broader spread or a slight shift compared to 2021, suggesting an increase in higher proficiency levels in some countries.
Basic or Above Skills: The combined category shows that the majority of countries have a high percentage of individuals with at least basic digital skills. The distributions are generally skewed towards higher values, with some movement between the years.
Show the code
# Set global font family
theme_set(theme_minimal(base_family = "Roboto"))

# Prepare data (pivot_wider)
digital_skills_hist <- digital_skills_distrib |>
  pivot_wider(names_from = indicator_level, values_from = value) |>
  clean_names()

# Define color for each proficiency level
colors <- c("Above Basic Skills" = "white",
            "Basic Skills" = "white",
            "Basic or Above Skills" = "white")


# Function to generate the plots for each skill
plot_skill_histograms <- function(data, skill) {
  skill_data <- data |>
    filter(digital_skills == skill)


  # Basic Skills plot
  plot_basic <- ggplot(skill_data, aes(x = individuals_with_basic_skills)) +
    geom_histogram(color = "#222222",
                   fill = colors["Basic Skills"],
                   binwidth = function(x) (max(x) - min(x)) / 5) +
    facet_grid(. ~ year) +
    labs(y = "Frequency",
         x = "",
         title = skill) +
    theme_ts() +
    theme(plot.title = element_text(size = 10,
                                    hjust = 0,
                                    color = "#525252"),
          axis.title.y = element_text(size = 10,
                                      margin = margin(r = 10),
                                      color = "#525252"),
          axis.text = element_text(size = 8.5,
                                   color = "#525252"),
          strip.text = element_blank(),
          panel.grid.minor = element_blank())


  # Above Basic Skills plot
  plot_above_basic <- ggplot(skill_data, aes(x = individuals_with_above_basic_skills)) +
    geom_histogram(color = "#33645FFF",
                   fill = colors["Above Basic Skills"],
                   binwidth = function(x) (max(x) - min(x)) / 5) +
    facet_grid(. ~ year) +
    labs(y = "",
         x = "") +
    theme_ts() +
    theme(plot.title = element_blank(),
          axis.title.y = element_blank(),
          axis.text = element_text(size = 8.5,
                                   color = "#525252"),
          strip.text = element_blank(),
          panel.grid.minor = element_blank())


  # Basic or Above Skills plot
  plot_basic_or_above <- ggplot(skill_data, aes(x = individuals_with_basic_or_above_basic_skills)) +
    geom_histogram(color = "#9D1B1FFF",
                   fill = colors["Basic or Above Skills"],
                   binwidth = function(x) (max(x) - min(x)) / 5) +
    facet_grid(. ~ year) +
    labs(y = "",
         x = "") +
    theme_ts() +
    theme(plot.title = element_blank(),
          axis.title.y = element_blank(),
          axis.text = element_text(size = 8.5,
                                   color = "#525252"),
          strip.text = element_blank(),
          panel.grid.minor = element_blank())

  # Combine the three plots into a single row
  combined_plot <- plot_basic + plot_above_basic + plot_basic_or_above +  plot_layout(ncol = 3,
               widths = c(1.1, 1.1, 1.1),
               guides = "collect")

  return(combined_plot)
}

# List of skills
skills_list <- c("Communication and Collaboration Skills",
                 "Digital Content Creation Skills",
                 "Information and Data Literacy Skills",
                 "Problem Solving Skills",
                 "Safety Skills",
                 "Overall Digital Skills")

# Generate and combine all plots using patchwork
all_plots <- lapply(skills_list, function(skill) plot_skill_histograms(digital_skills_hist, skill)) |>
  wrap_plots(ncol = 1)


# Create a custom legend plot
legend_plot <- ggplot() +
  # Row 1: Proficiency Level annotations
  annotate("text", x = 0.15, y = 0.98, label = "Basic Skills", size = 4, hjust = 0, color = "#222222") +
  annotate("text", x = 1.15, y = 0.98, label = "Above Basic Skills", size = 4, hjust = 0, color = "#33645FFF") +
  annotate("text", x = 2.1, y = 0.98, label = "Basic or Above Skills", size = 4, hjust = 0, color = "#9D1B1FFF") +
  # Row 2: Year annotations
  annotate("text", x = 0.08, y = 0.9, label = "2021", size = 4, hjust = 0, color = "#222222") +
  annotate("text", x = 0.48, y = 0.9, label = "2023", size = 4, hjust = 0, color = "#222222") +
  annotate("text", x = 1.1, y = 0.9, label = "2021", size = 4, hjust = 0, color = "#33645FFF") +
  annotate("text", x = 1.6, y = 0.9, label = "2023", size = 4, hjust = 0, color = "#33645FFF") +
  annotate("text", x = 2.1, y = 0.9, label = "2021", size = 4, hjust = 0, color = "#9D1B1FFF") +
  annotate("text", x = 2.7, y = 0.9, label = "2023", size = 4, hjust = 1, color = "#9D1B1FFF") +
  # Adjust themes to avoid extra elements
  theme_void() +
  theme(plot.margin = margin(0, 0, 0.5, 0, "cm")) +
  coord_cartesian(clip = "off") # Ensure text isn't clipped
# Adjust spacing
legend_plot <- legend_plot + plot_layout(heights = unit(1, "cm"))


# Combine the custom legend with the main plot
histogram_plot <- (legend_plot / all_plots) +
  plot_layout(heights = c(0.05, 0.95)) + # Adjust the height of the legend
  plot_annotation(
    title = "Distribution of Digital Skills by Proficiency Level",
    subtitle = "% of individuals | age 16-74 | EU countries",
    theme = theme(plot.title = element_text(size = 20,
                                            color = "#252525",
                                            face = "bold",
                                            margin = margin(b = 10)),
                  plot.subtitle = element_text(size = 16,
                                            color = "#525252",
                                            margin = margin(b = 15))
)
  )
The boxplots summarize the distribution of digital skills proficiency across EU countries by displaying the median (middle line), quartiles (the box), and potential outliers (dots outside the whiskers).
The violin plots add context by illustrating the density of the data, showing how the values are distributed across different proficiency levels.
For example, in “Problem Solving Skills” (Basic Skills), the boxplot shows the central 50% of countries within the box, with a clear median line. Also, the boxplot shows us clearly the outliers (extreme values), small circles or dots, indicating countries with significantly different proficiency levels compared to others.
In another example, “Communication and Collaboration Skills” (Above Basic Skills, 2023), the boxplot shows that the central 50% of countries have proficiency levels roughly between 70% and 90%, with the median at about 80%.
Show the code
# Set global font family
theme_set(theme_minimal(base_family = "Roboto"))

color_palette = c("Individuals with basic skills" = "#252525",
                  "Individuals with above basic skills" = "#33645FFF",
                  "Individuals with basic or above basic skills" = "#9D1B1FFF")


# Reorder digital_skills so "Overall Digital Skills" appears last
digital_skills_distrib <- digital_skills_distrib |>
  mutate(digital_skills = fct_relevel(digital_skills, "Overall Digital Skills", after = Inf))

boxplot_plot <- ggplot(digital_skills_distrib,
       aes(x = value,
           y = indicator_level,
           color = indicator_level)) +
  geom_violin() +
  geom_boxplot(width = 0.3, alpha = 0.5) +
  scale_color_manual(values = color_palette,
                    labels = c("Individuals with basic skills" = "Basic Skills",
                              "Individuals with above basic skills" = "Above Basic Skills",
                              "Individuals with basic or above basic skills" = "Basic or Above Skills")) +
  scale_x_continuous(position = "top", labels = scales::percent_format(scale = 1)) +
  facet_grid(digital_skills ~ year, labeller = label_wrap_gen(10), switch = "y") +
  theme_minimal() +
  labs(
    title = "Distribution of Digital Skills by Proficiency Level",
    subtitle = "% of individuals | age 16-74 | EU countries",
  ) +
  theme_ts() +
  theme(
    axis.title = element_blank(),
    axis.text.y = element_blank(),
    axis.text.x = element_text(size = 10, color = "#525252"),
    axis.line.x = element_line(color = "grey90"),
    axis.ticks.x = element_line(color = "#525252"),
    strip.text.y.left = element_text(size = 10, color = "#525252",
                              angle = 0, hjust = 0),
    strip.text.x = element_text(size = 12, color = "#525252"),
    strip.placement = "outside",
    strip.background = element_blank(),
    panel.grid.minor = element_blank(),
    legend.title = element_blank(),
    legend.text = element_text(size = 9, color = "#525252"),
    legend.justification.top = 0,
    panel.spacing = unit(1.5, "lines"),
    plot.title = element_text(size = 20, color = "#252525"),
    plot.subtitle = element_text(size = 16, color = "#525252")
  )

Trends in Digital Skills Across Categories, Years, and Skill Levels
Below are some key observations based on the above analysis:
- General Trends Over Time
Across all skill categories, there is a general improvement in skill levels from 2021 to 2023. For example, the percentage of individuals with above basic Communication and Collaboration skills increased from 79.96% in 2021 to 82.84% in 2023. Similarly, individuals with above basic Problem-solving skills saw an increase from 55.53% in 2021 to 58.05% in 2023. These improvements suggest that the EU is making positive steps toward achieving its 2030 digital skills goals. However, the progress also highlights the need for sustained efforts to ensure that all areas of digital competency are advancing at a similar pace.
- Strengths and Opportunities in Digital Skills Development
The data shows a notable concentration of individuals with above basic skills, especially in categories like Communication and Collaboration and Information and Data Literacy. For example, in 2023, while only 6.64% of individuals had basic communication and collaboration skills, 82.84% had above-basic skills. This indicates a strong proficiency at higher levels in these areas, reflecting significant progress. However, this pattern is not consistent across all skill categories. In areas such as Safety, Problem-solving and Digital Content Creation, the proportion of individuals with above basic skills is much lower, highlighting the need for targeted efforts to boost advanced competencies in these critical domains.
- Overall Digital Skills
When examining Overall Digital Skills, the percentage of individuals with above basic skills is considerably lower compared to specific skills. In 2023, only 28.98% of individuals had above basic overall digital skills. This suggests that while people may excel in specific areas, comprehensive digital proficiency across all indicators remains a challenge.
- Safety and Digital Content Creation Skills
The data indicates that Safety and Digital Content Creation skills are generally weaker compared to other areas. In 2021, only 43.65% of individuals had above basic safety skills, and 46.56% had above basic digital content creation skills. In contrast, higher percentages were observed in areas like Information and Data Literacy (74.42%) and Communication and Collaboration (79.96%). This trend continues in 2023, suggesting a need for targeted initiatives to improve safety and content creation skills.Targeted initiatives, such as specialized training programs or awareness campaigns, could help improve competencies in these critical domains.
- Range of Skills Levels
There is considerable variation across regions or countries, as implied by the minimum and maximum values. For instance, in 2023, the range for above basic Problem-solving skills spans from 21.93% to 87.4%, indicating a significant gap between the most and least proficient groups. Although country-specific details I will explore in a separate analysis, the overall variation highlights the need for tailored interventions that address the unique challenges faced by different regions within the EU.
- Stability of Median Values
The median values across years are generally stable, indicating that improvements in mean values are not driven by outliers. This stability suggests consistent progress across the population rather than isolated improvements among a few groups. However, there are some exceptions, such as in Problem-solving skills and Overall Digital skills, basic or above skills, where extreme values are more prominent.
- Variability of skills
There is low variability in basic skills. For example, the standard deviations for basic skills, such as Information and Data Literacy and Communication and Collaboration skills, are low, indicating consistent skill levels among individuals. In contrast, there is higher variability in above basic skills. The standard deviations for above basic skills, particularly in Digital Content Creation and Information and Data Literacy, are significantly higher, reflecting greater differences in proficiency levels among individuals.
Among the six categories, Problem Solving Skills and Safety Skills exhibit the highest variability, suggesting a wide range of abilities within these areas.
Conclusion
The data analysis reveals both progress and challenges in the development of digital skills across the EU. While improvements from 2021 to 2023 are encouraging, disparities in skill levels and the slower progress in certain areas, such as Safety and Digital Content Creation, indicate that more targeted policies and initiatives are necessary.
Overall, while there is positive momentum, the findings suggest that achieving comprehensive digital proficiency across the EU will require continued and targeted efforts. Addressing regional disparities and focusing on advancing individuals from basic to above basic skills will be crucial for meeting the EU’s 2030 digital literacy goals.
Footnotes
Lahti L., Huovari J., Kainu M., and Biecek P. (2017). Retrieval and analysis of Eurostat open data with the eurostat package. The R Journal 9(1), pp. 385-392. doi: 10.32614/RJ-2017-019 Lahti, L., Huovari J., Kainu M., Biecek P., Hernangomez D., Antal D., and Kantanen P. (2023). eurostat: Tools for Eurostat Open Data [Computer software]. R package version 4.0.0. https://github.com/rOpenGov/eurostat↩︎
Wickham H, Averick M, Bryan J, Chang W, McGowan LD, François R, Grolemund G, Hayes A, Henry L, Hester J, Kuhn M, Pedersen TL, Miller E, Bache SM, Müller K, Ooms J, Robinson D, Seidel DP, Spinu V, Takahashi K, Vaughan D, Wilke C, Woo K, Yutani H (2019). “Welcome to the tidyverse.” Journal of Open Source Software, 4(43), 1686. doi:10.21105/joss.01686 https://doi.org/10.21105/joss.01686.↩︎
Firke S (2023). janitor: Simple Tools for Examining and Cleaning Dirty Data. R package version 2.2.0, https://CRAN.R-project.org/package=janitor.↩︎
Lin G (2023). reactable: Interactive Data Tables for R. R package version 0.4.4, https://CRAN.R-project.org/package=reactable.↩︎
Pedersen T (2024). patchwork: The Composer of Plots. https://patchwork.data-imaginist.com, https://github.com/thomasp85/patchwork.↩︎

