EU Digital Skills Indicator
Base Plot
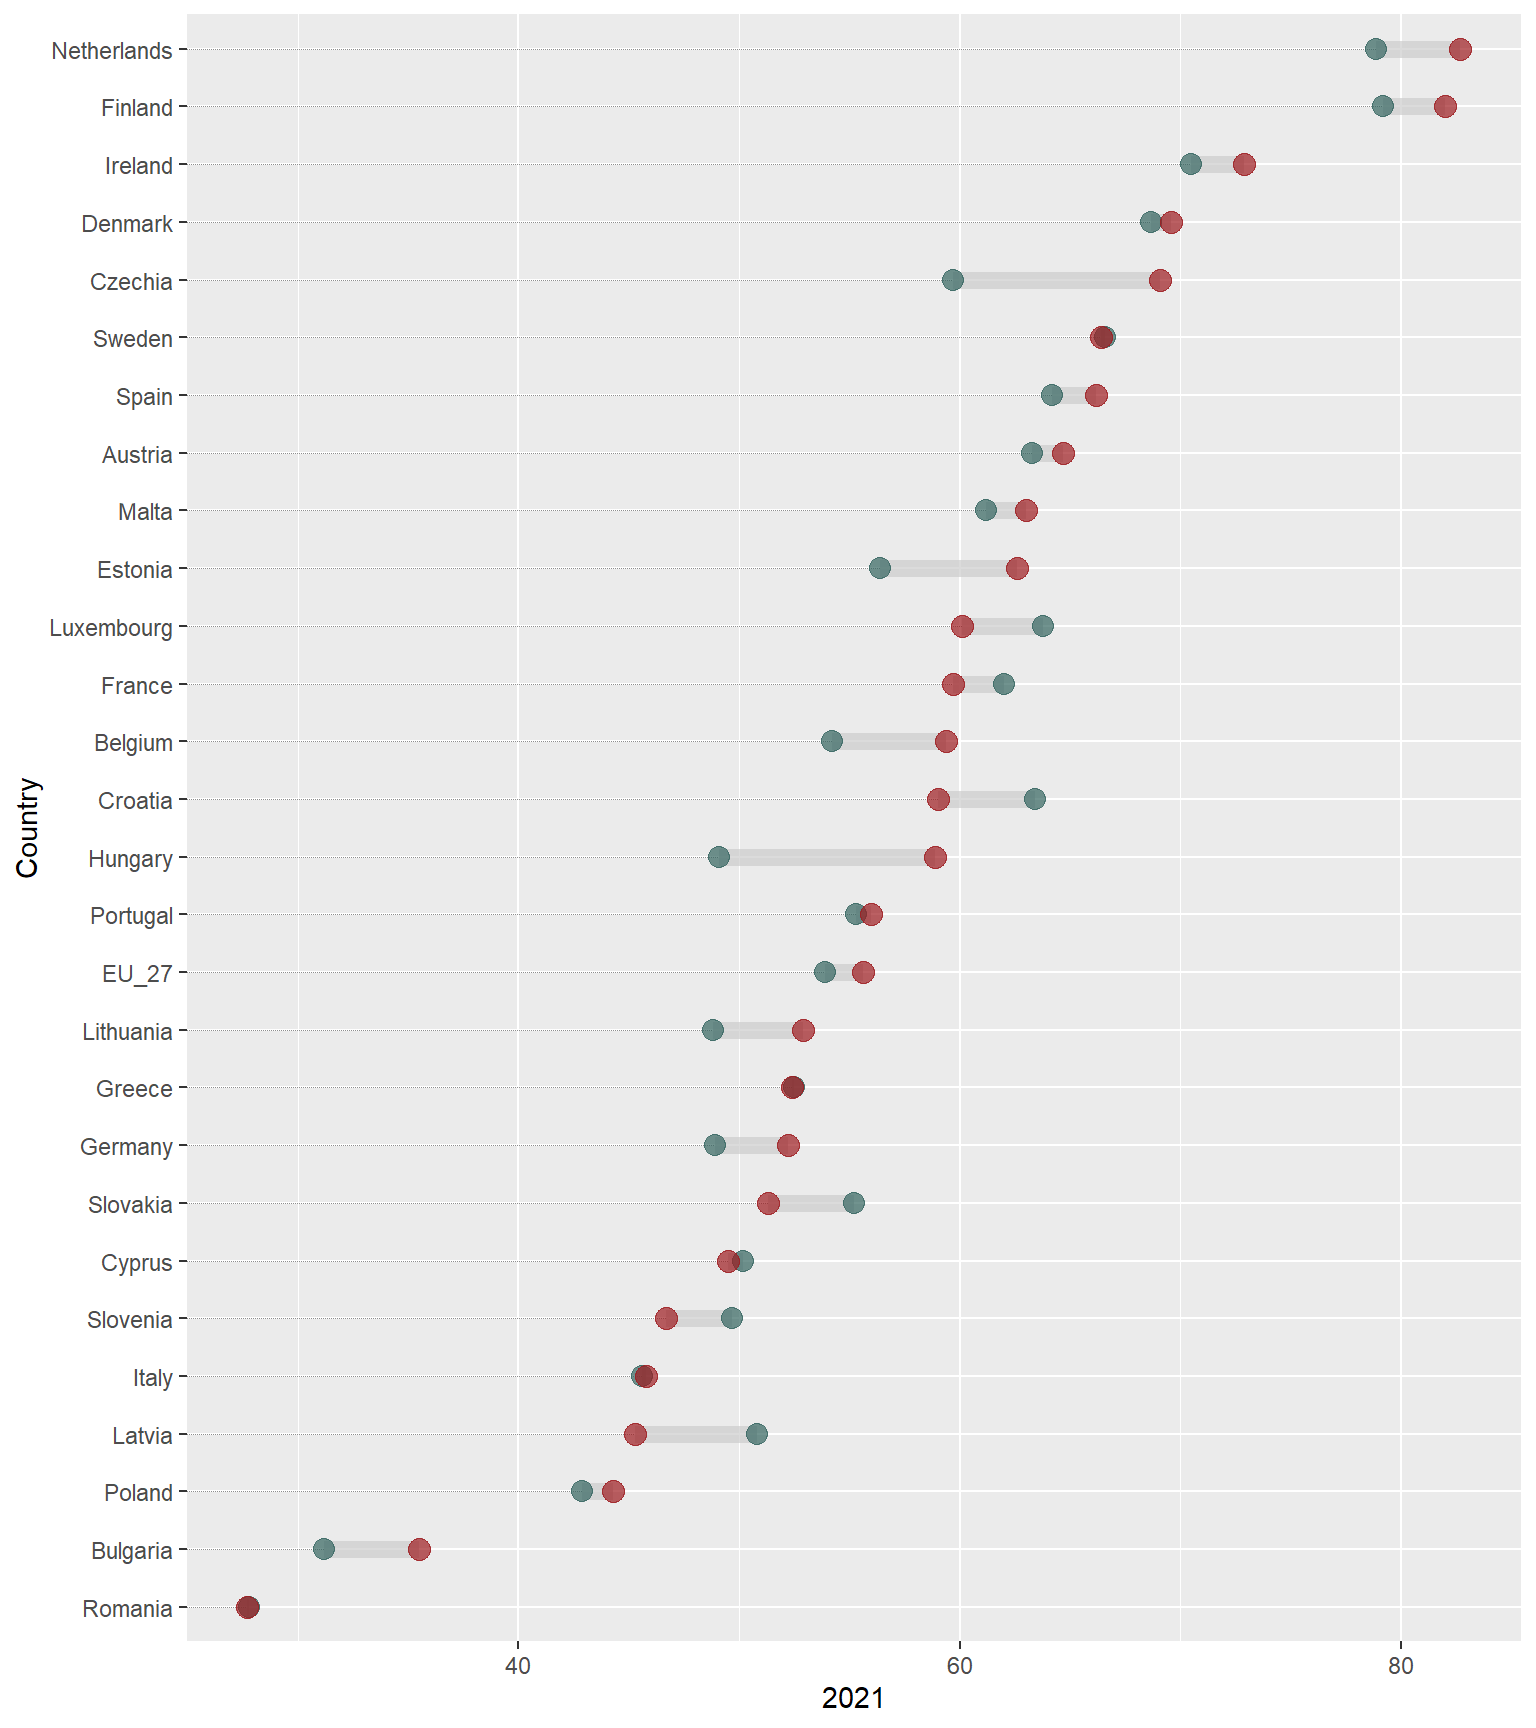
Adding Custom X Axis Labels
dsi |>
  mutate(Country = fct_reorder(Country, `2023`)) |>
  ggplot(aes(x = `2021`,
             xend = `2023`,
             y = Country,
             group = Country)) +
  geom_dumbbell(colour = "grey80",
                size = 3,
                colour_xend = "#9D1B1FFF",
                colour_x = "#33645FFF",
                alpha = 0.7,
                dot_guide = TRUE,
dot_guide_size = 0.15) +
scale_x_continuous(labels = scales::percent_format(scale = 1),
limits = c(0, 100),
breaks = seq(0, 100, by = 20))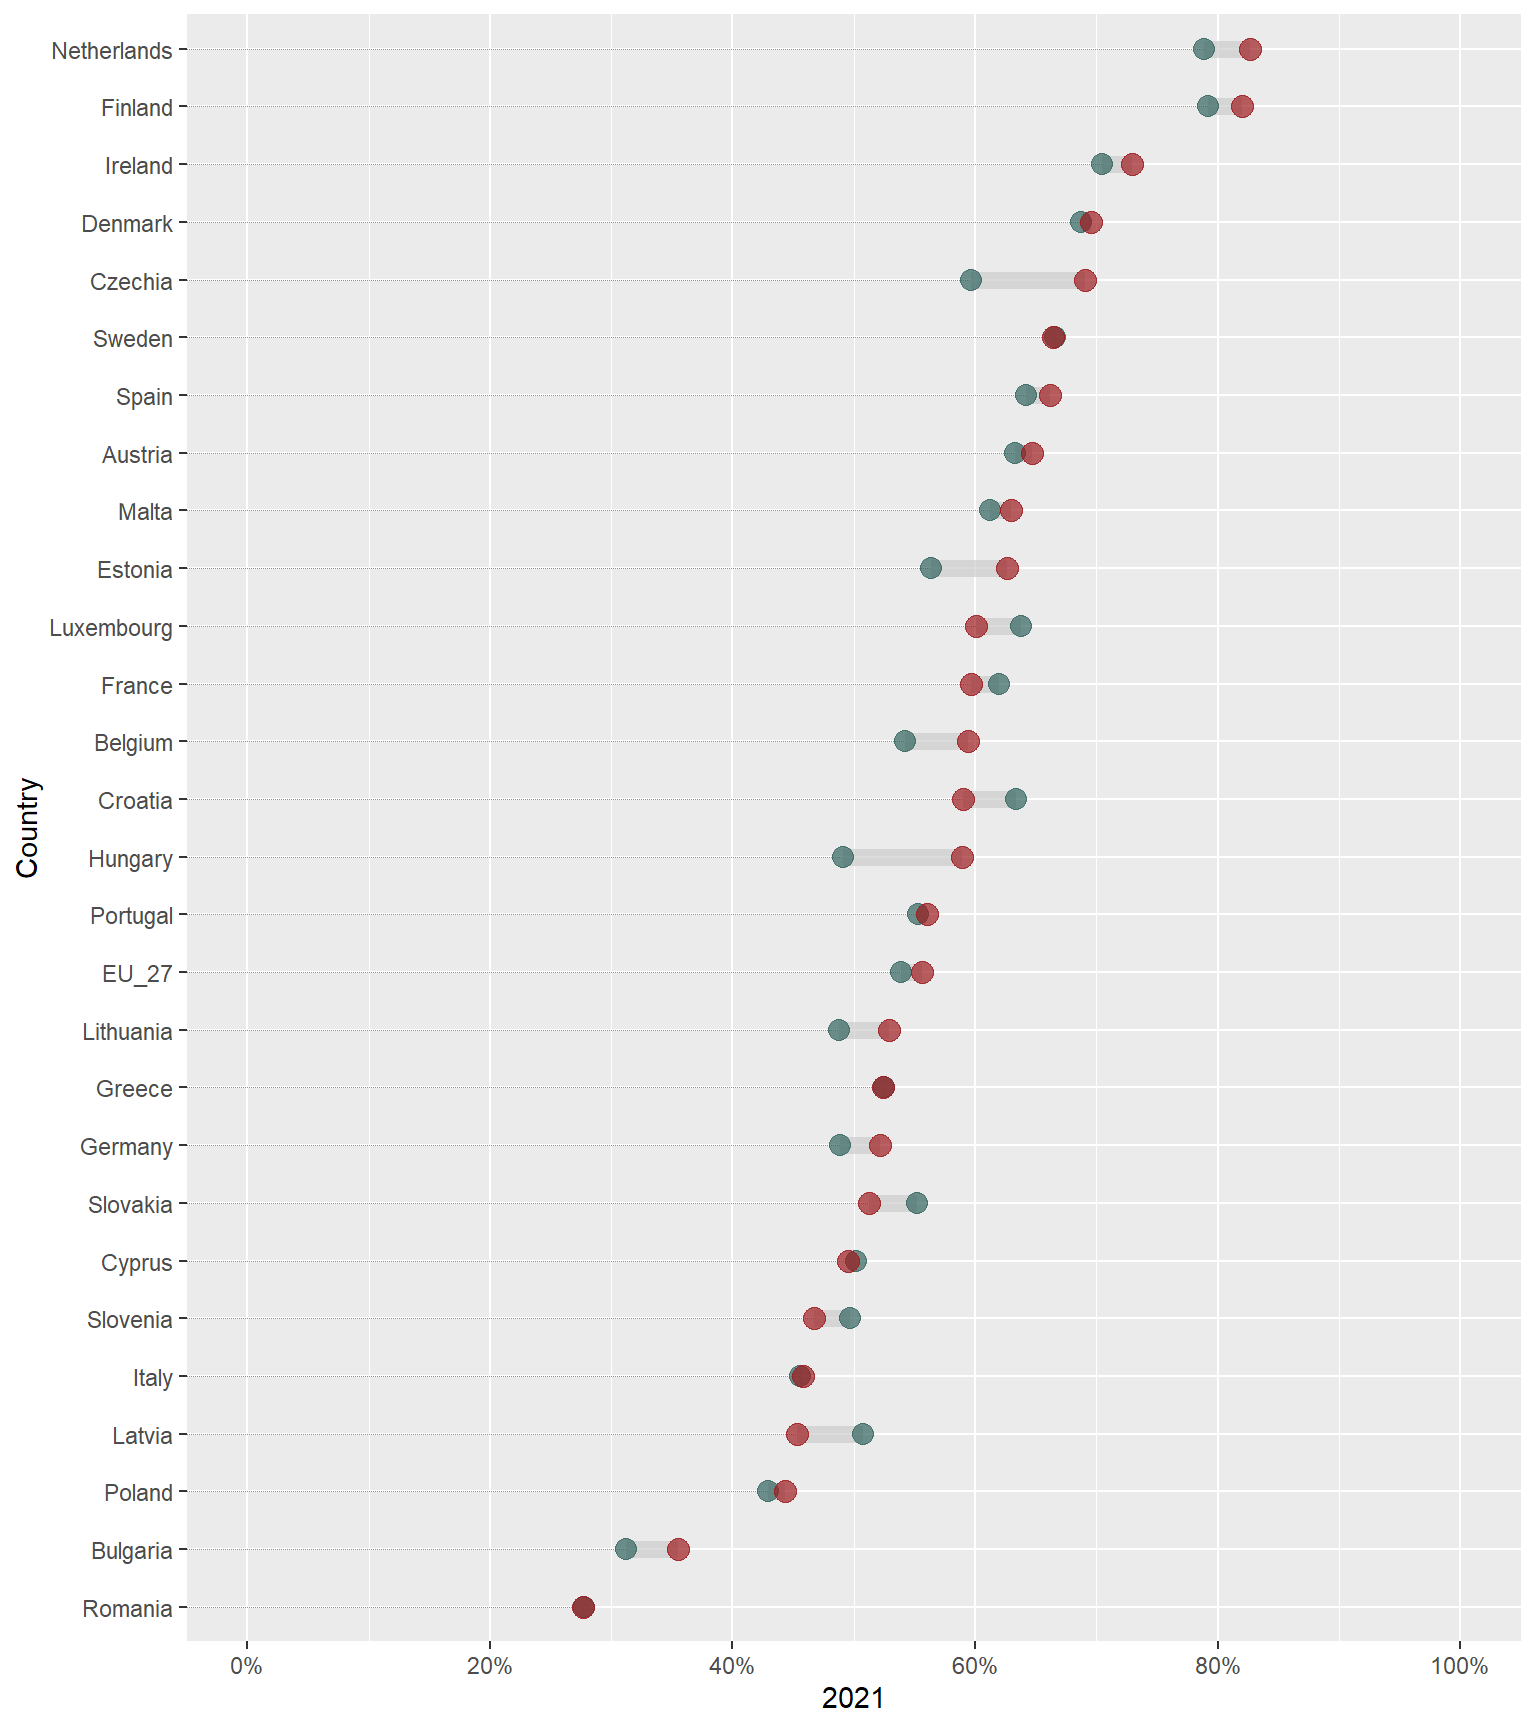
Adding Title, Subtitle and Caption
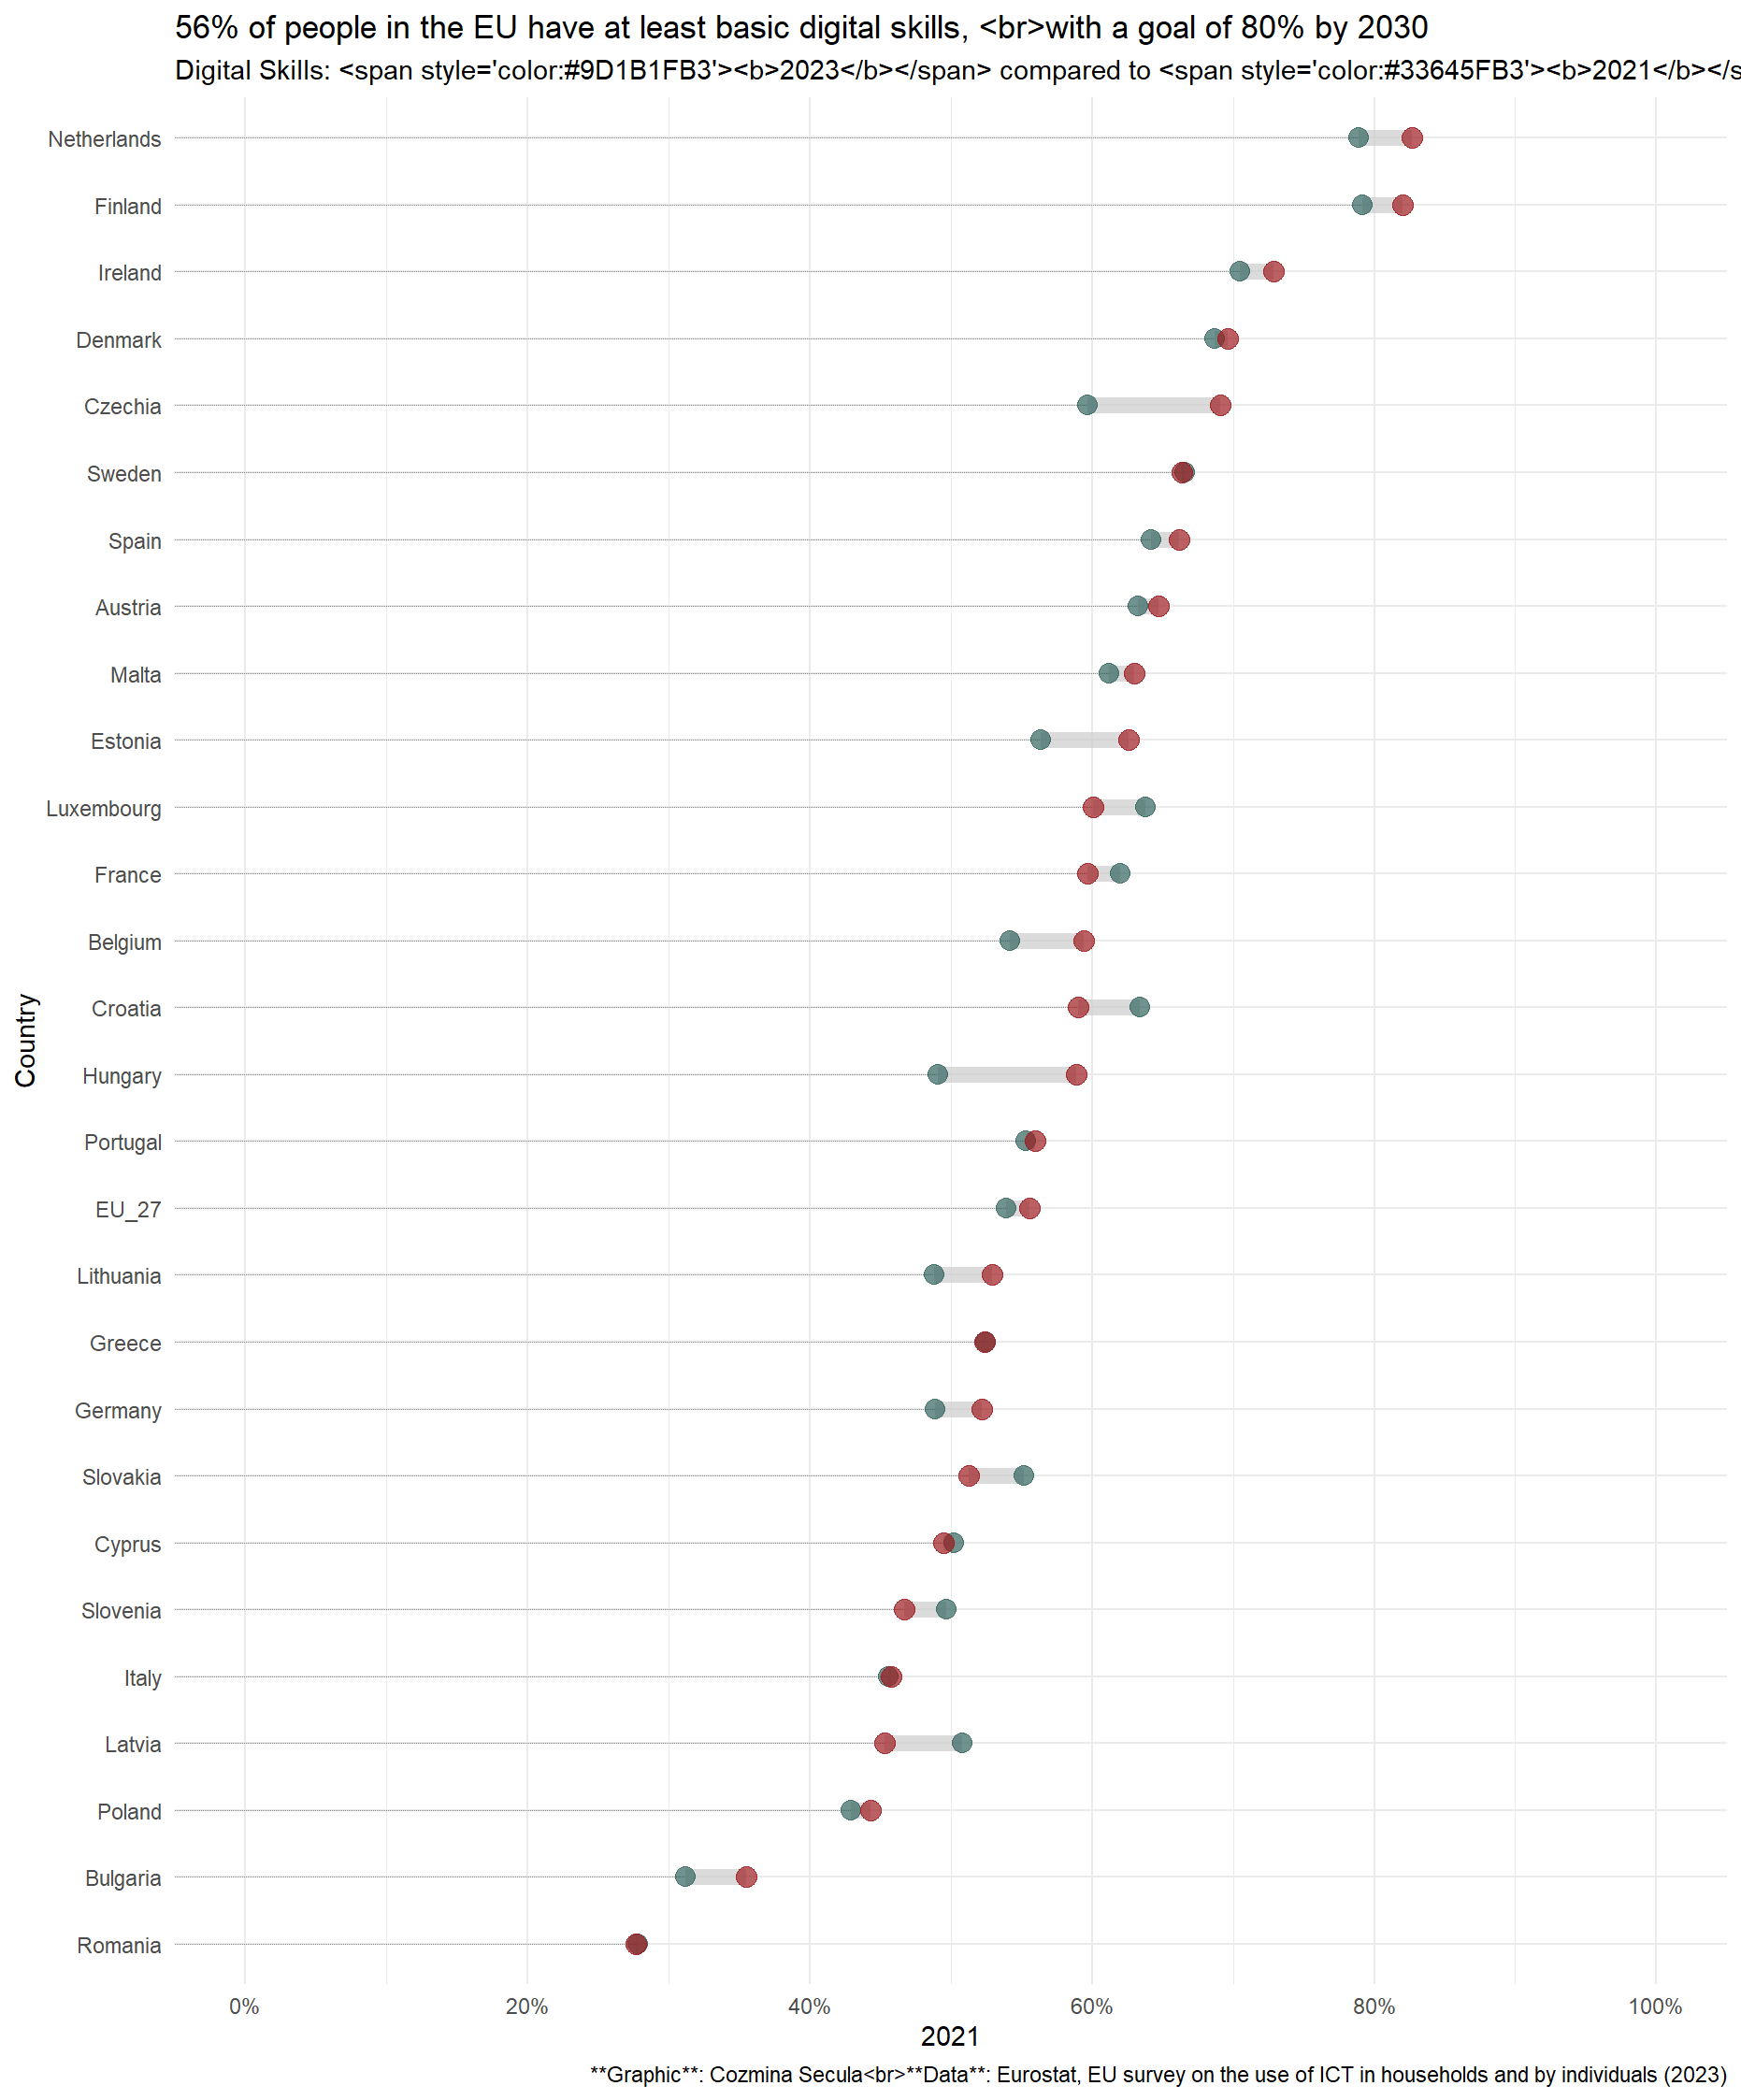
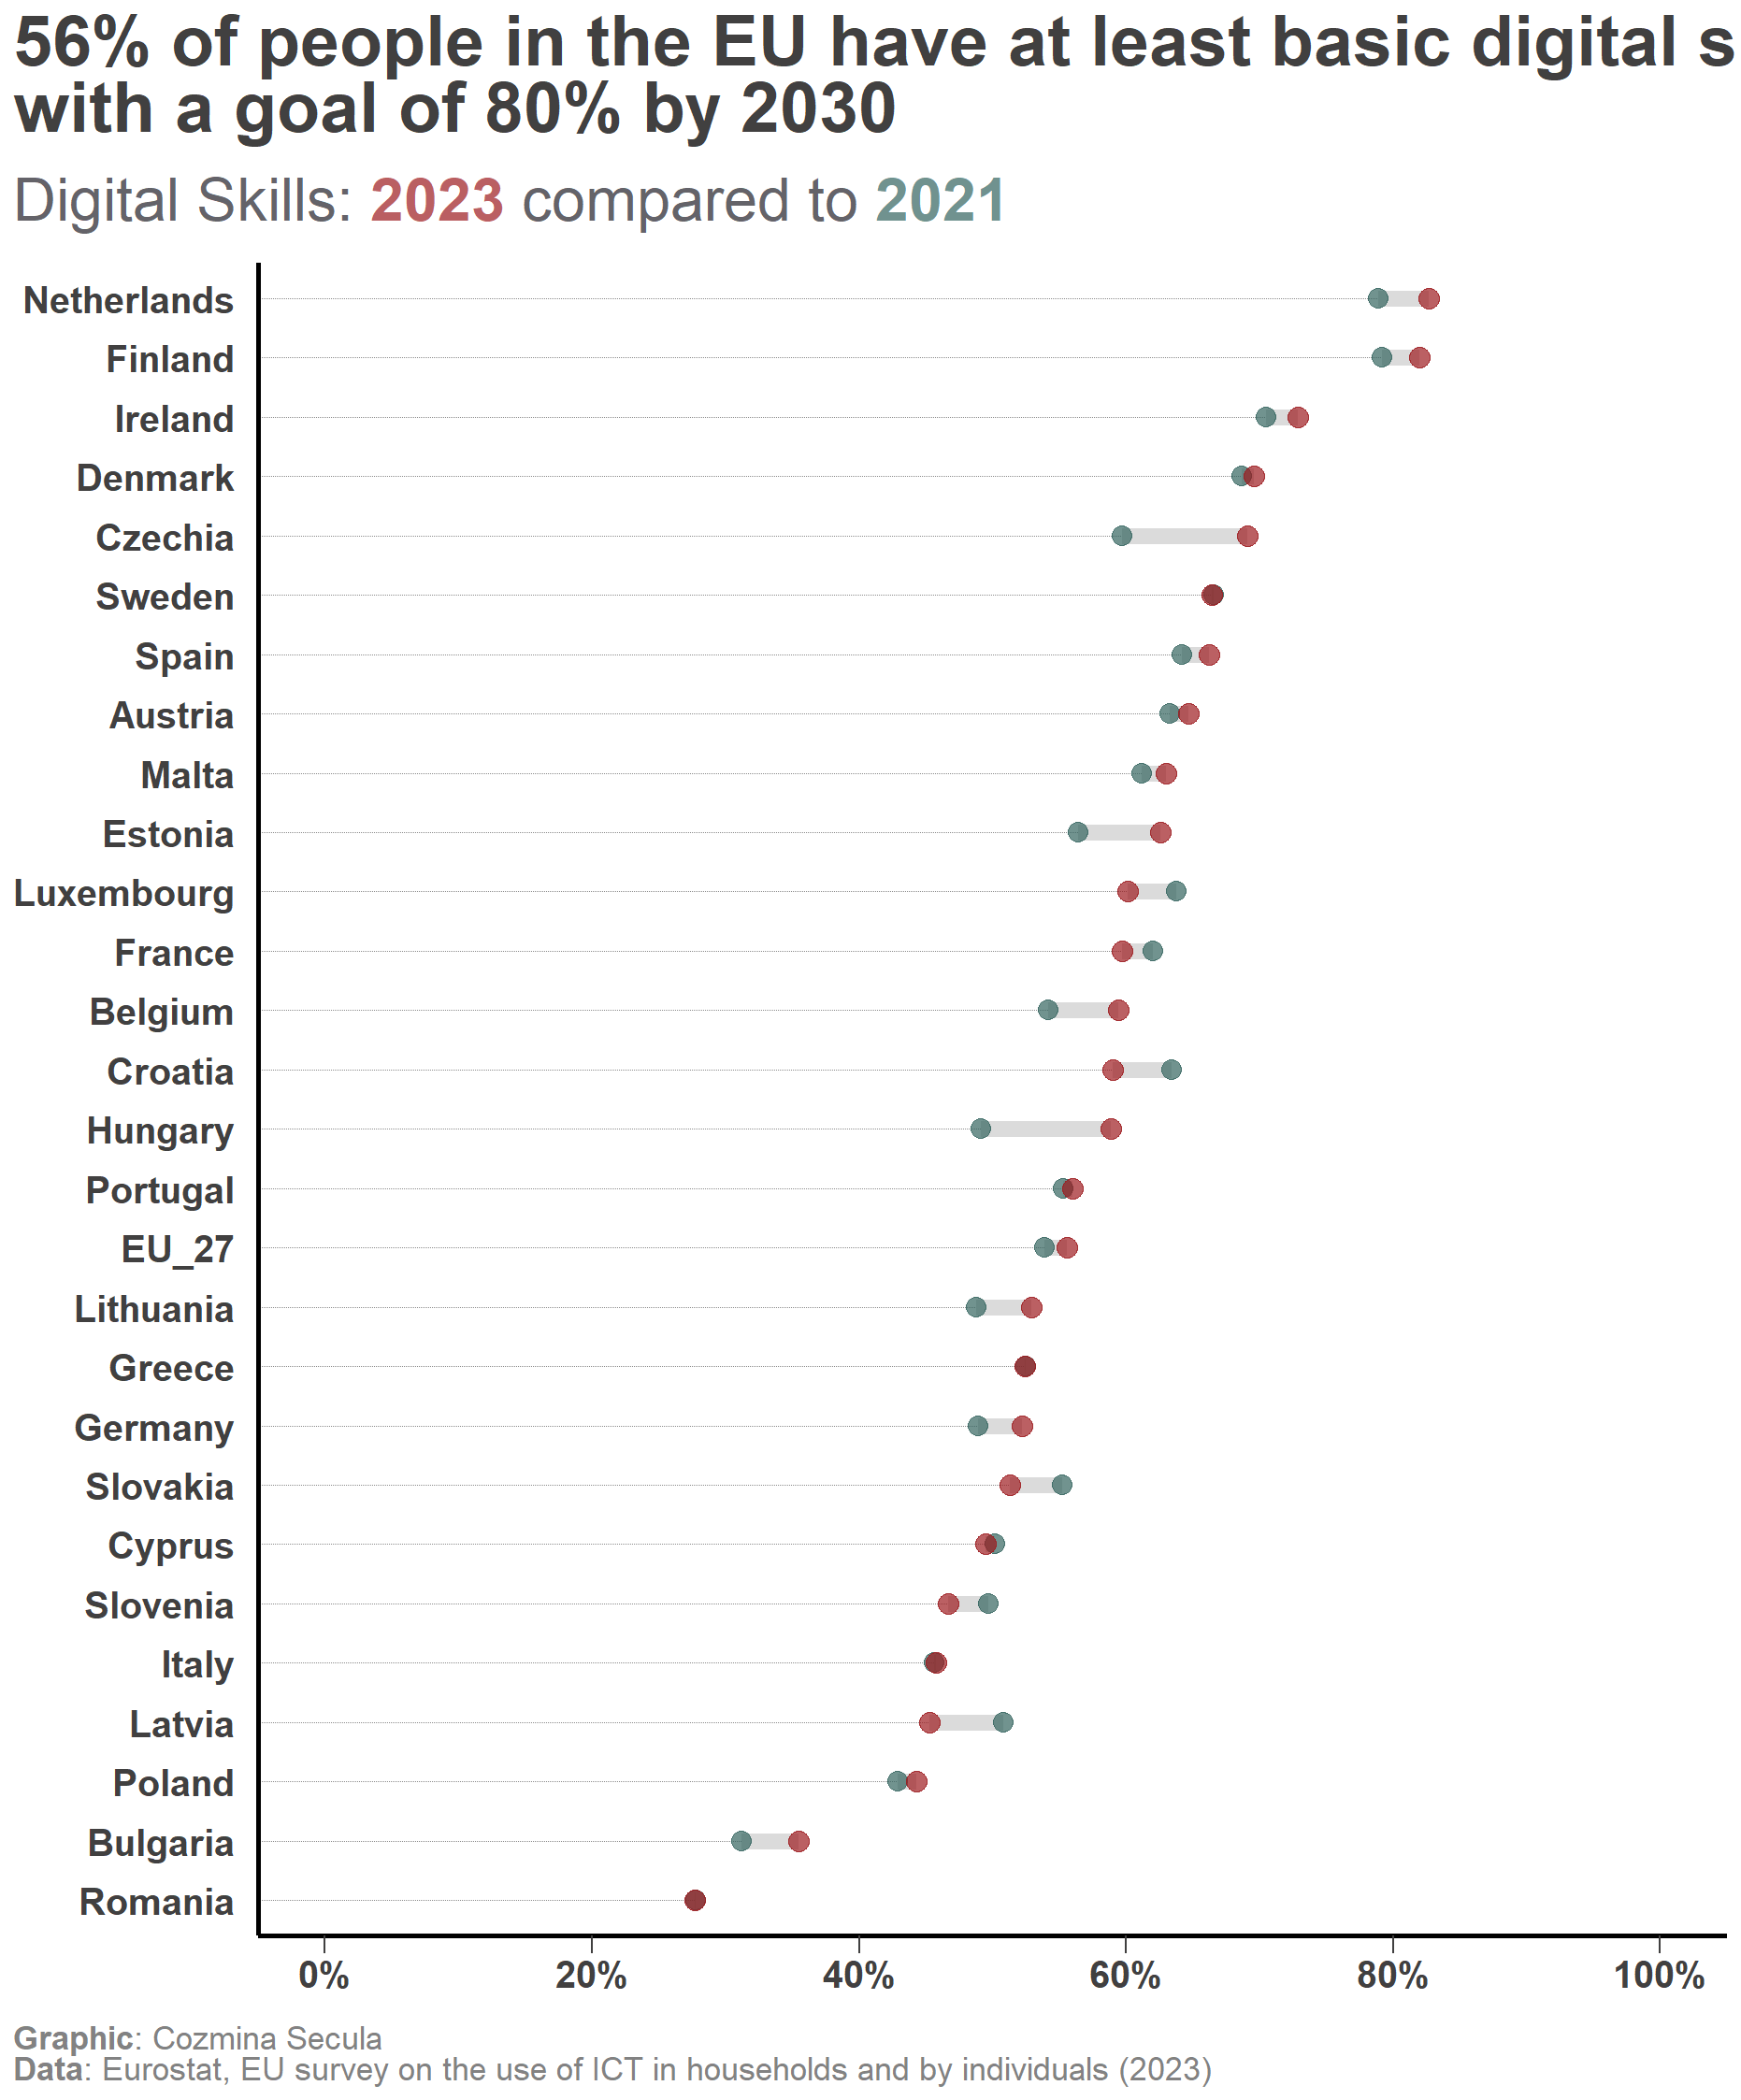
title <- glue::glue("56% of people in the EU have at least basic digital skills, <br>with a goal of 80% by 2030")
subtitle <- glue::glue("Digital Skills: <span style='color:#9D1B1FB3'><b>2023</b></span> compared to <span style='color:#33645FB3'><b>2021</b></span>")
caption <- paste0("**Graphic**: Cozmina Secula<br>**Data**: Eurostat, EU survey on the use of ICT in households and by individuals (2023)")
dsi |>
  mutate(Country = fct_reorder(Country, `2023`)) |>
  ggplot(aes(x = `2021`,
             xend = `2023`,
             y = Country,
             group = Country)) +
  geom_dumbbell(colour = "grey80",
                size = 3,
                colour_xend = "#9D1B1FFF",
                colour_x = "#33645FFF",
                alpha = 0.7,
                dot_guide = TRUE,
                dot_guide_size = 0.15) +
  scale_x_continuous(labels = scales::percent_format(scale = 1),
                     limits = c(0, 100),
breaks = seq(0, 100, by = 20)) +
theme_minimal() +
labs(
title = title,
subtitle = subtitle,
caption = caption
)
Adding Custom Theme
dsi |>
  mutate(Country = fct_reorder(Country, `2023`)) |>
  ggplot(aes(x = `2021`,
             xend = `2023`,
             y = Country,
             group = Country)) +
  geom_dumbbell(colour = "grey80",
                size = 3,
                colour_xend = "#9D1B1FFF",
                colour_x = "#33645FFF",
                alpha = 0.7,
                dot_guide = TRUE,
                dot_guide_size = 0.15) +
  scale_x_continuous(labels = scales::percent_format(scale = 1),
                     limits = c(0, 100),
                     breaks = seq(0, 100, by = 20)) +
  theme_minimal() +
  labs(
    title = title,
    subtitle = subtitle,
    caption = caption
  ) +
  theme(
    axis.title = element_blank(),
    panel.grid.major.y = element_blank(),
    axis.ticks.x = element_line(linewidth = 0.5, color = "#414040"),
    axis.ticks.length = unit(.25, "cm"),
    plot.title = element_markdown(color = "#414040",
                                  size = 28,
                                  family = "Georgia",
                                  face = "bold",
                                  margin = margin(0, 0, 12, 0)),
    plot.title.position = "plot",
    panel.grid.major.x = element_blank(),
    panel.grid.minor.x = element_blank(),
    axis.line.y.left = element_line(linewidth = 1),
    axis.line.x.bottom = element_line(linewidth = 1),
    axis.text = element_text(family = "Georgia",
                             color = "#414040",
                             size = 15,
                             face = "bold",
                             hjust = 0.5),
    plot.subtitle = element_textbox_simple(size = 24,
                                           vjust = 1,
                                           margin = margin(0, 0, 12, 0),
                                           color = "#646369",
                                           family = "Georgia"),
    plot.caption = element_markdown(color = "#828282",
                                    size = 13,
                                    hjust = 0,
                                    family = "Georgia",
                                    margin = margin(12, 0, 0, 0)),
    plot.caption.position = "plot"
  )
Adding Custom Text
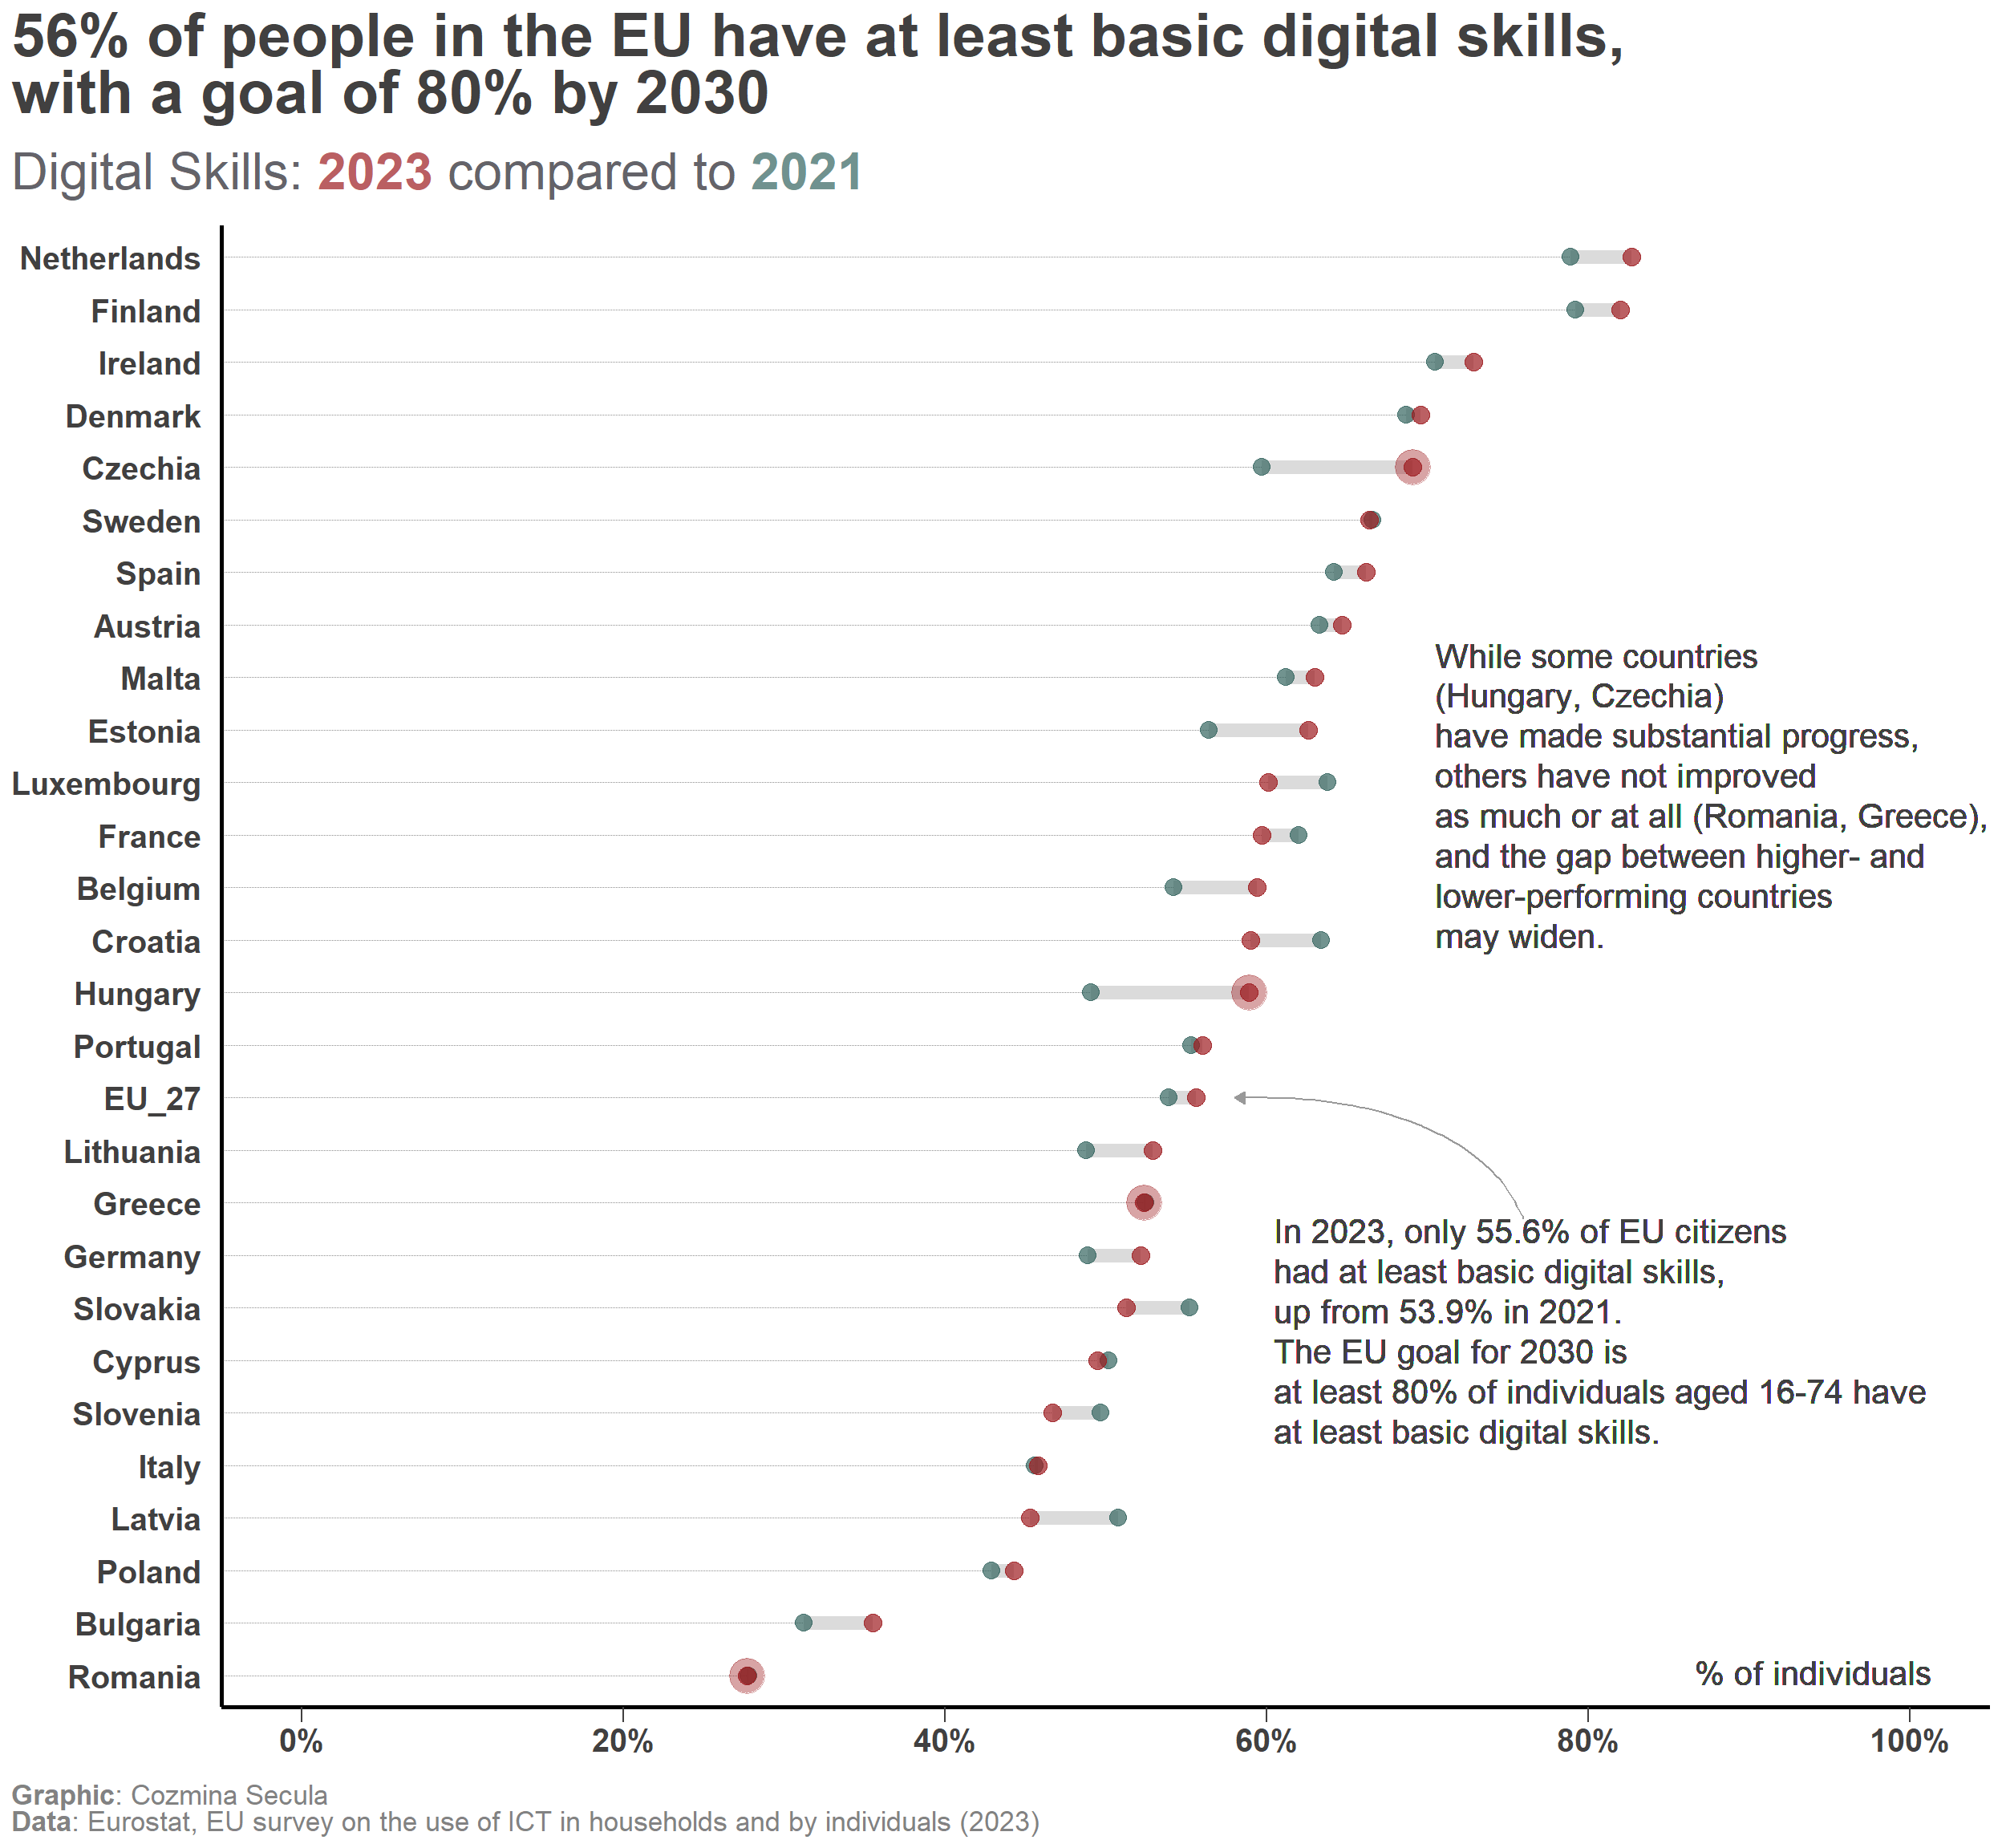
callout_1 <- paste0("While some countries <br> (Hungary, Czechia) <br> have made substantial progress, <br> others have not improved <br>as much or at all (Romania, Greece), <br>and the gap between higher- and <br>lower-performing countries <br> may widen.")
callout_2 <- paste0("In 2023, only 55.6% of EU citizens <br> had at least basic digital skills,<br> up from 53.9% in 2021. <br>The EU goal for 2030 is <br>at least 80% of individuals aged 16-74 have <br>at least basic digital skills.")

dsi |>
  mutate(Country = fct_reorder(Country, `2023`)) |>
  ggplot(aes(x = `2021`,
             xend = `2023`,
             y = Country,
             group = Country)) +
  geom_dumbbell(colour = "grey80",
                size = 3,
                colour_xend = "#9D1B1FFF",
                colour_x = "#33645FFF",
                alpha = 0.7,
                dot_guide = TRUE,
                dot_guide_size = 0.15) +
  scale_x_continuous(labels = scales::percent_format(scale = 1),
                     limits = c(0, 100),
                     breaks = seq(0, 100, by = 20)) +
  theme_minimal() +
  labs(
    title = title,
    subtitle = subtitle,
    caption = caption
  ) +
  theme(
    axis.title = element_blank(),
    panel.grid.major.y = element_blank(),
    axis.ticks.x = element_line(linewidth = 0.5, color = "#414040"),
    axis.ticks.length = unit(.25, "cm"),
    plot.title = element_markdown(color = "#414040",
                                  size = 28,
                                  family = "Georgia",
                                  face = "bold",
                                  margin = margin(0, 0, 12, 0)),
    plot.title.position = "plot",
    panel.grid.major.x = element_blank(),
    panel.grid.minor.x = element_blank(),
    axis.line.y.left = element_line(linewidth = 1),
    axis.line.x.bottom = element_line(linewidth = 1),
    axis.text = element_text(family = "Georgia",
                             color = "#414040",
                             size = 15,
                             face = "bold",
                             hjust = 0.5),
    plot.subtitle = element_textbox_simple(size = 24,
                                           vjust = 1,
                                           margin = margin(0, 0, 12, 0),
                                           color = "#646369",
                                           family = "Georgia"),
    plot.caption = element_markdown(color = "#828282",
                                    size = 13,
                                    hjust = 0,
                                    family = "Georgia",
                                    margin = margin(12, 0, 0, 0)),
    plot.caption.position = "plot"
  ) +
  geom_richtext(
    aes(x = 94, y = 1, label = "% of individuals"),
    size = 5.5, lineheight = 1.2, family = "Georgia",
    color = "#414040", label.colour = NA, fill = NA) +

  geom_richtext(
    aes(x = 70, y = 21, label = callout_1),
    family = "Georgia", size = 5.5, lineheight = 1.2,
    color = "#414040", hjust = 0, vjust = 1.03,
    label.color = NA, fill = NA) +

  geom_richtext(
    aes(x = 60, y = 10, label = callout_2),
    family = "Georgia", size = 5.5, lineheight = 1.2,
    color = "#414040", hjust = 0, vjust = 1.03,
    label.color = NA, fill = NA) +

  annotate("curve", x = 76, xend = 58, y = 9.7, yend = 12,
           curvature = 0.35, angle = 60, color = "grey60",
           linewidth = .4, arrow = arrow(type = "closed", length = unit(.08, "inches"))) +

  # Highlight countries with significant improvements
  geom_point(data = dsi |>
               filter(Country %in% c("Hungary", "Czechia", "Romania", "Greece")),
             aes(x = `2023`, y = Country),
             color = "#9D1B1FFF", size = 7.5, alpha = 0.4)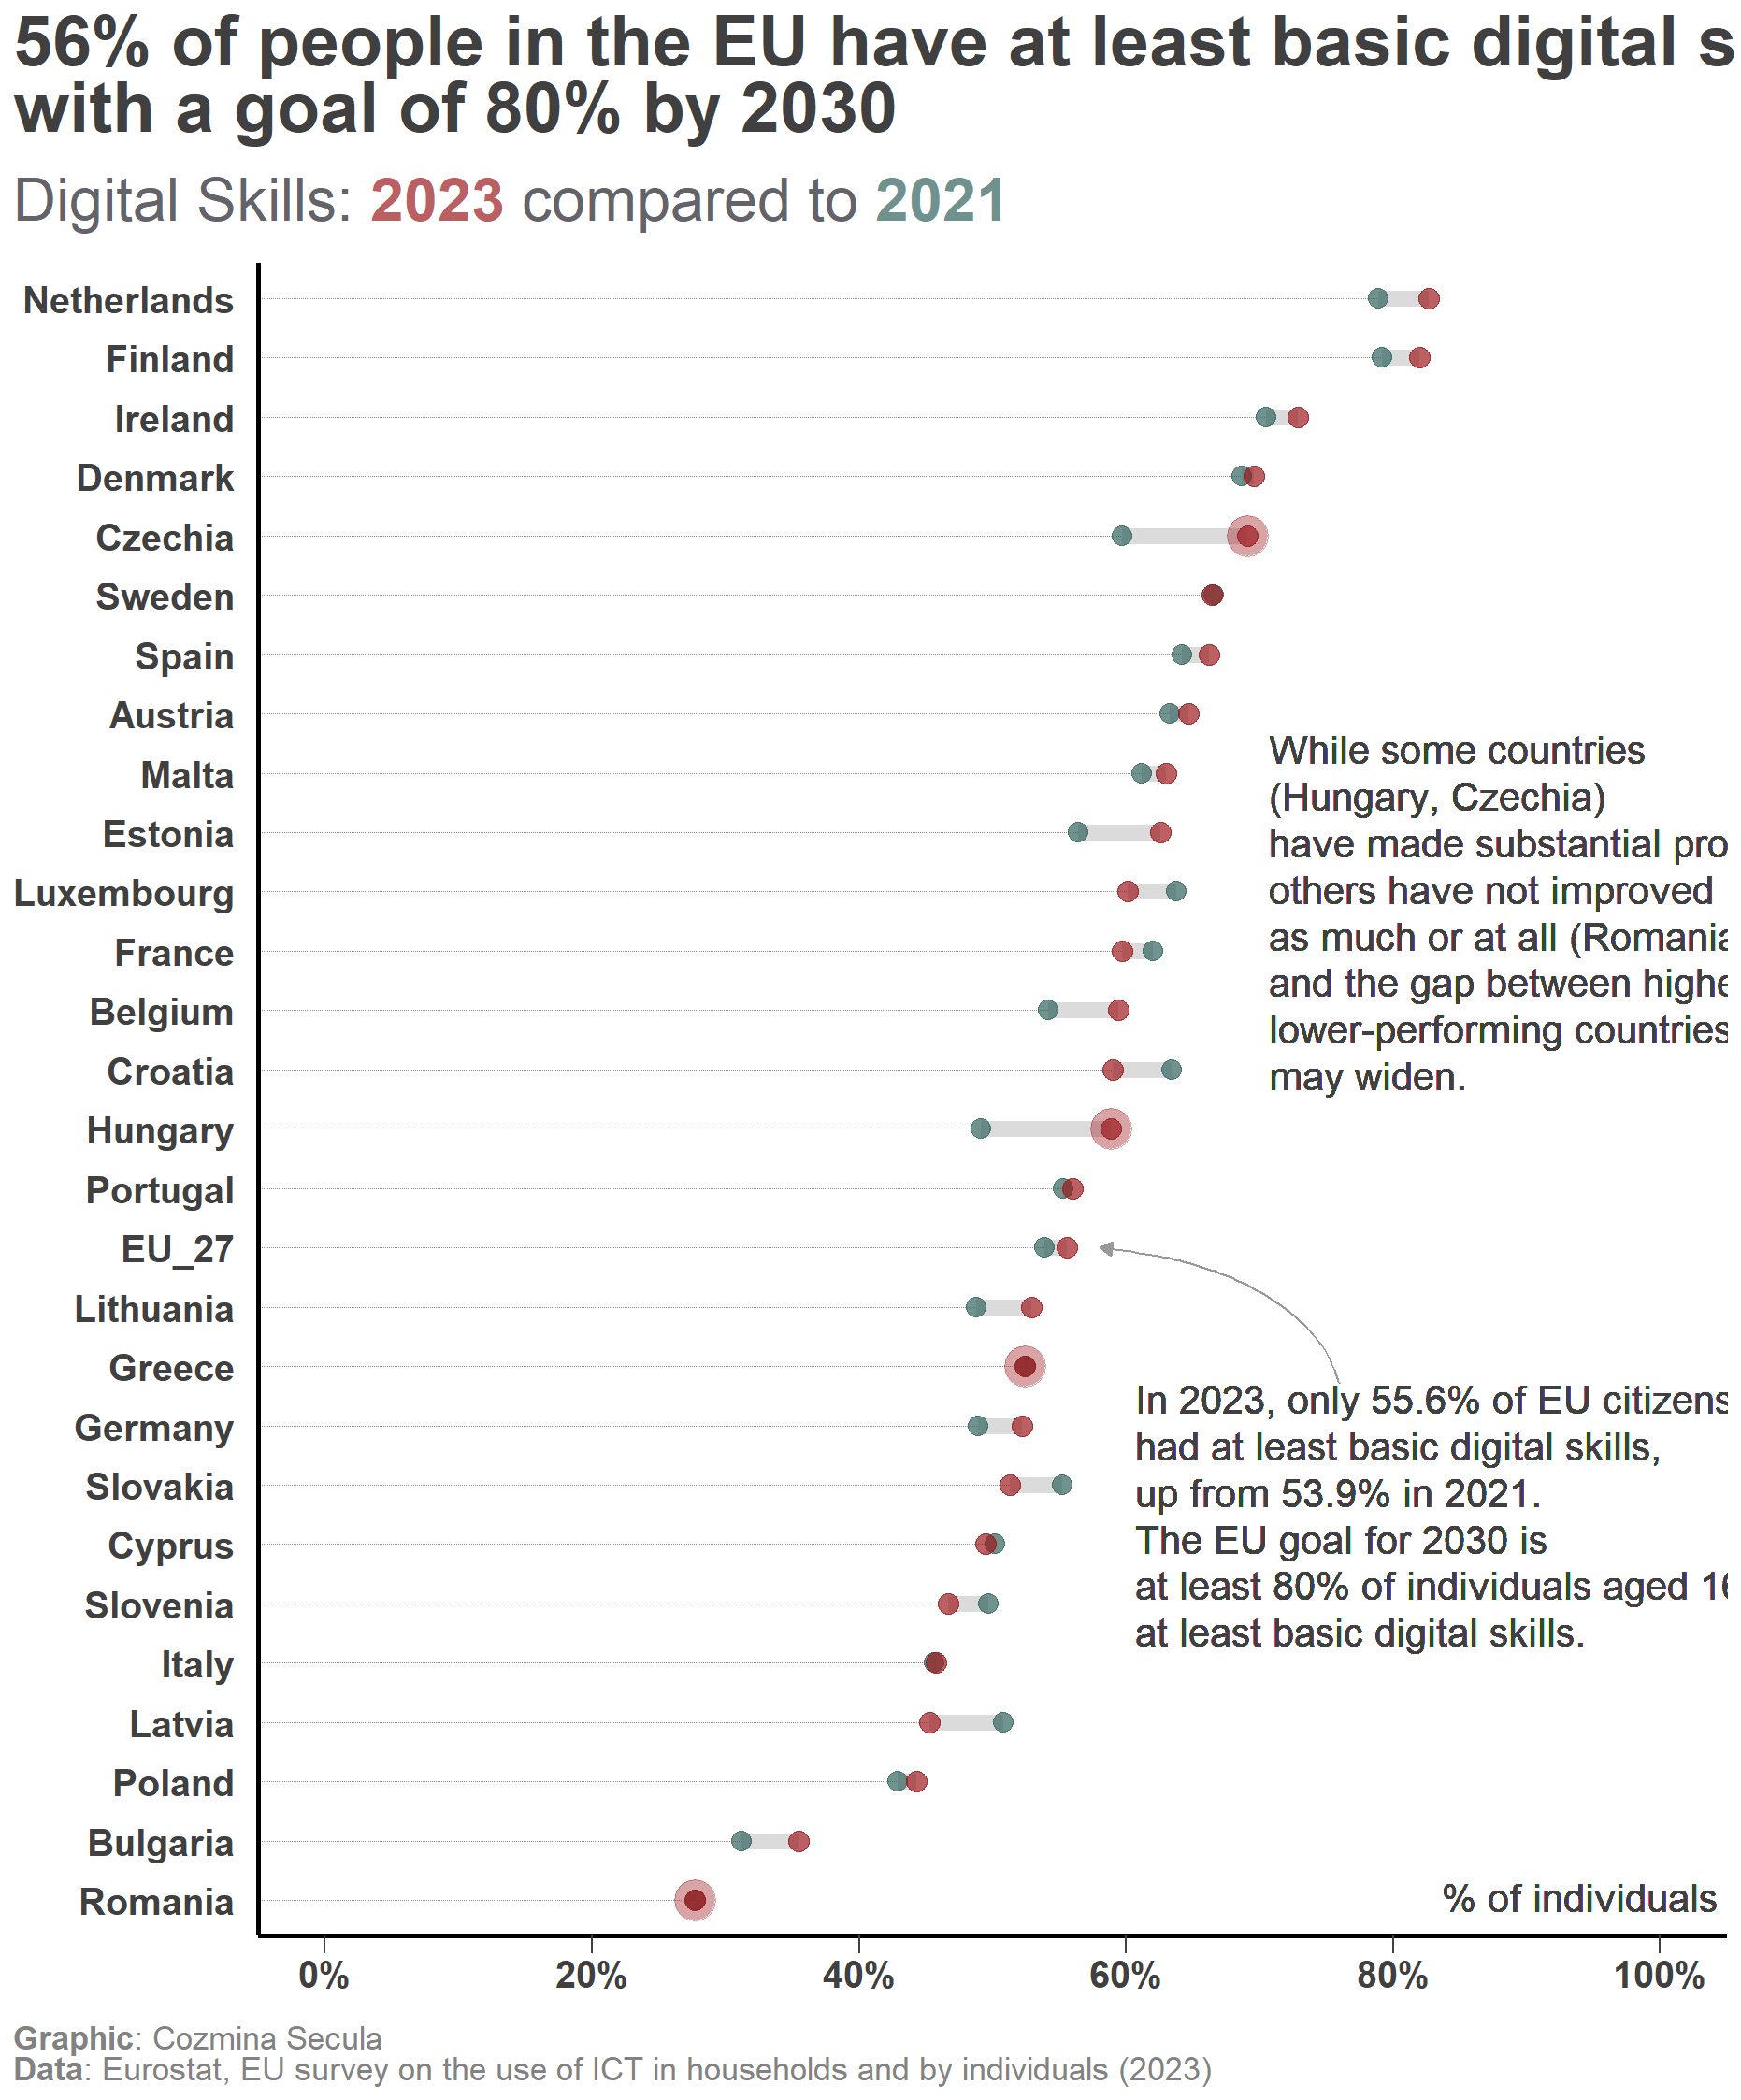
Final Visualization