About
Posts
Categories
All
(12)
SQL
(2)
charts
(1)
chi-squared test
(1)
cross-table
(1)
dashboard
(1)
data analysis
(6)
data cleaning
(1)
data visualization
(9)
digital intensity index
(2)
digital skills indicator
(2)
empirical study
(1)
eurostat
(4)
key driver analysis
(1)
qualitative analysis
(1)
quantitative analysis
(2)
resources
(1)
sales data
(1)
summary statistics
(1)
t-test
(1)
time series
(1)
trends
(1)
well-being at work
(1)
Translate Widget
Posts
Order By
Default
Title
Date - Oldest
Date - Newest
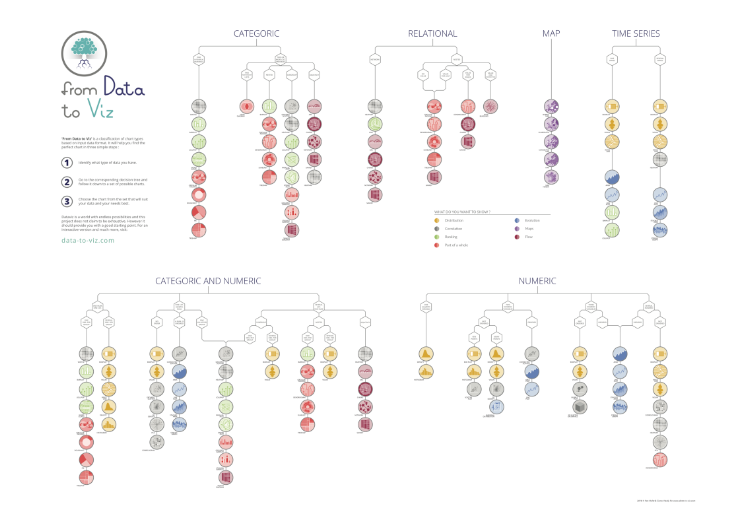
What are the main types of charts, and how do they differ in their use cases?
data visualization
charts
resources
Key resources I use to understand the main categories of chart types.
Nov 11, 2024
Analyzing the Digital Skills Indicator in the Context of the EU Digital Decade (Part II)
data analysis
data visualization
eurostat
digital skills indicator
An Exploratory Data Analysis on how countries’ Digital Skills Indicator scores in 2023 compare to their performance in 2021.
Sep 12, 2024
Analyzing the Digital Skills Indicator in the Context of the EU Digital Decade (Part I)
data analysis
data visualization
eurostat
digital skills indicator
An Exploratory Data Analysis of the components of the Digital Skills Indicator using data from the EU surveys on ICT use in households and by individuals provided by…
Aug 21, 2024
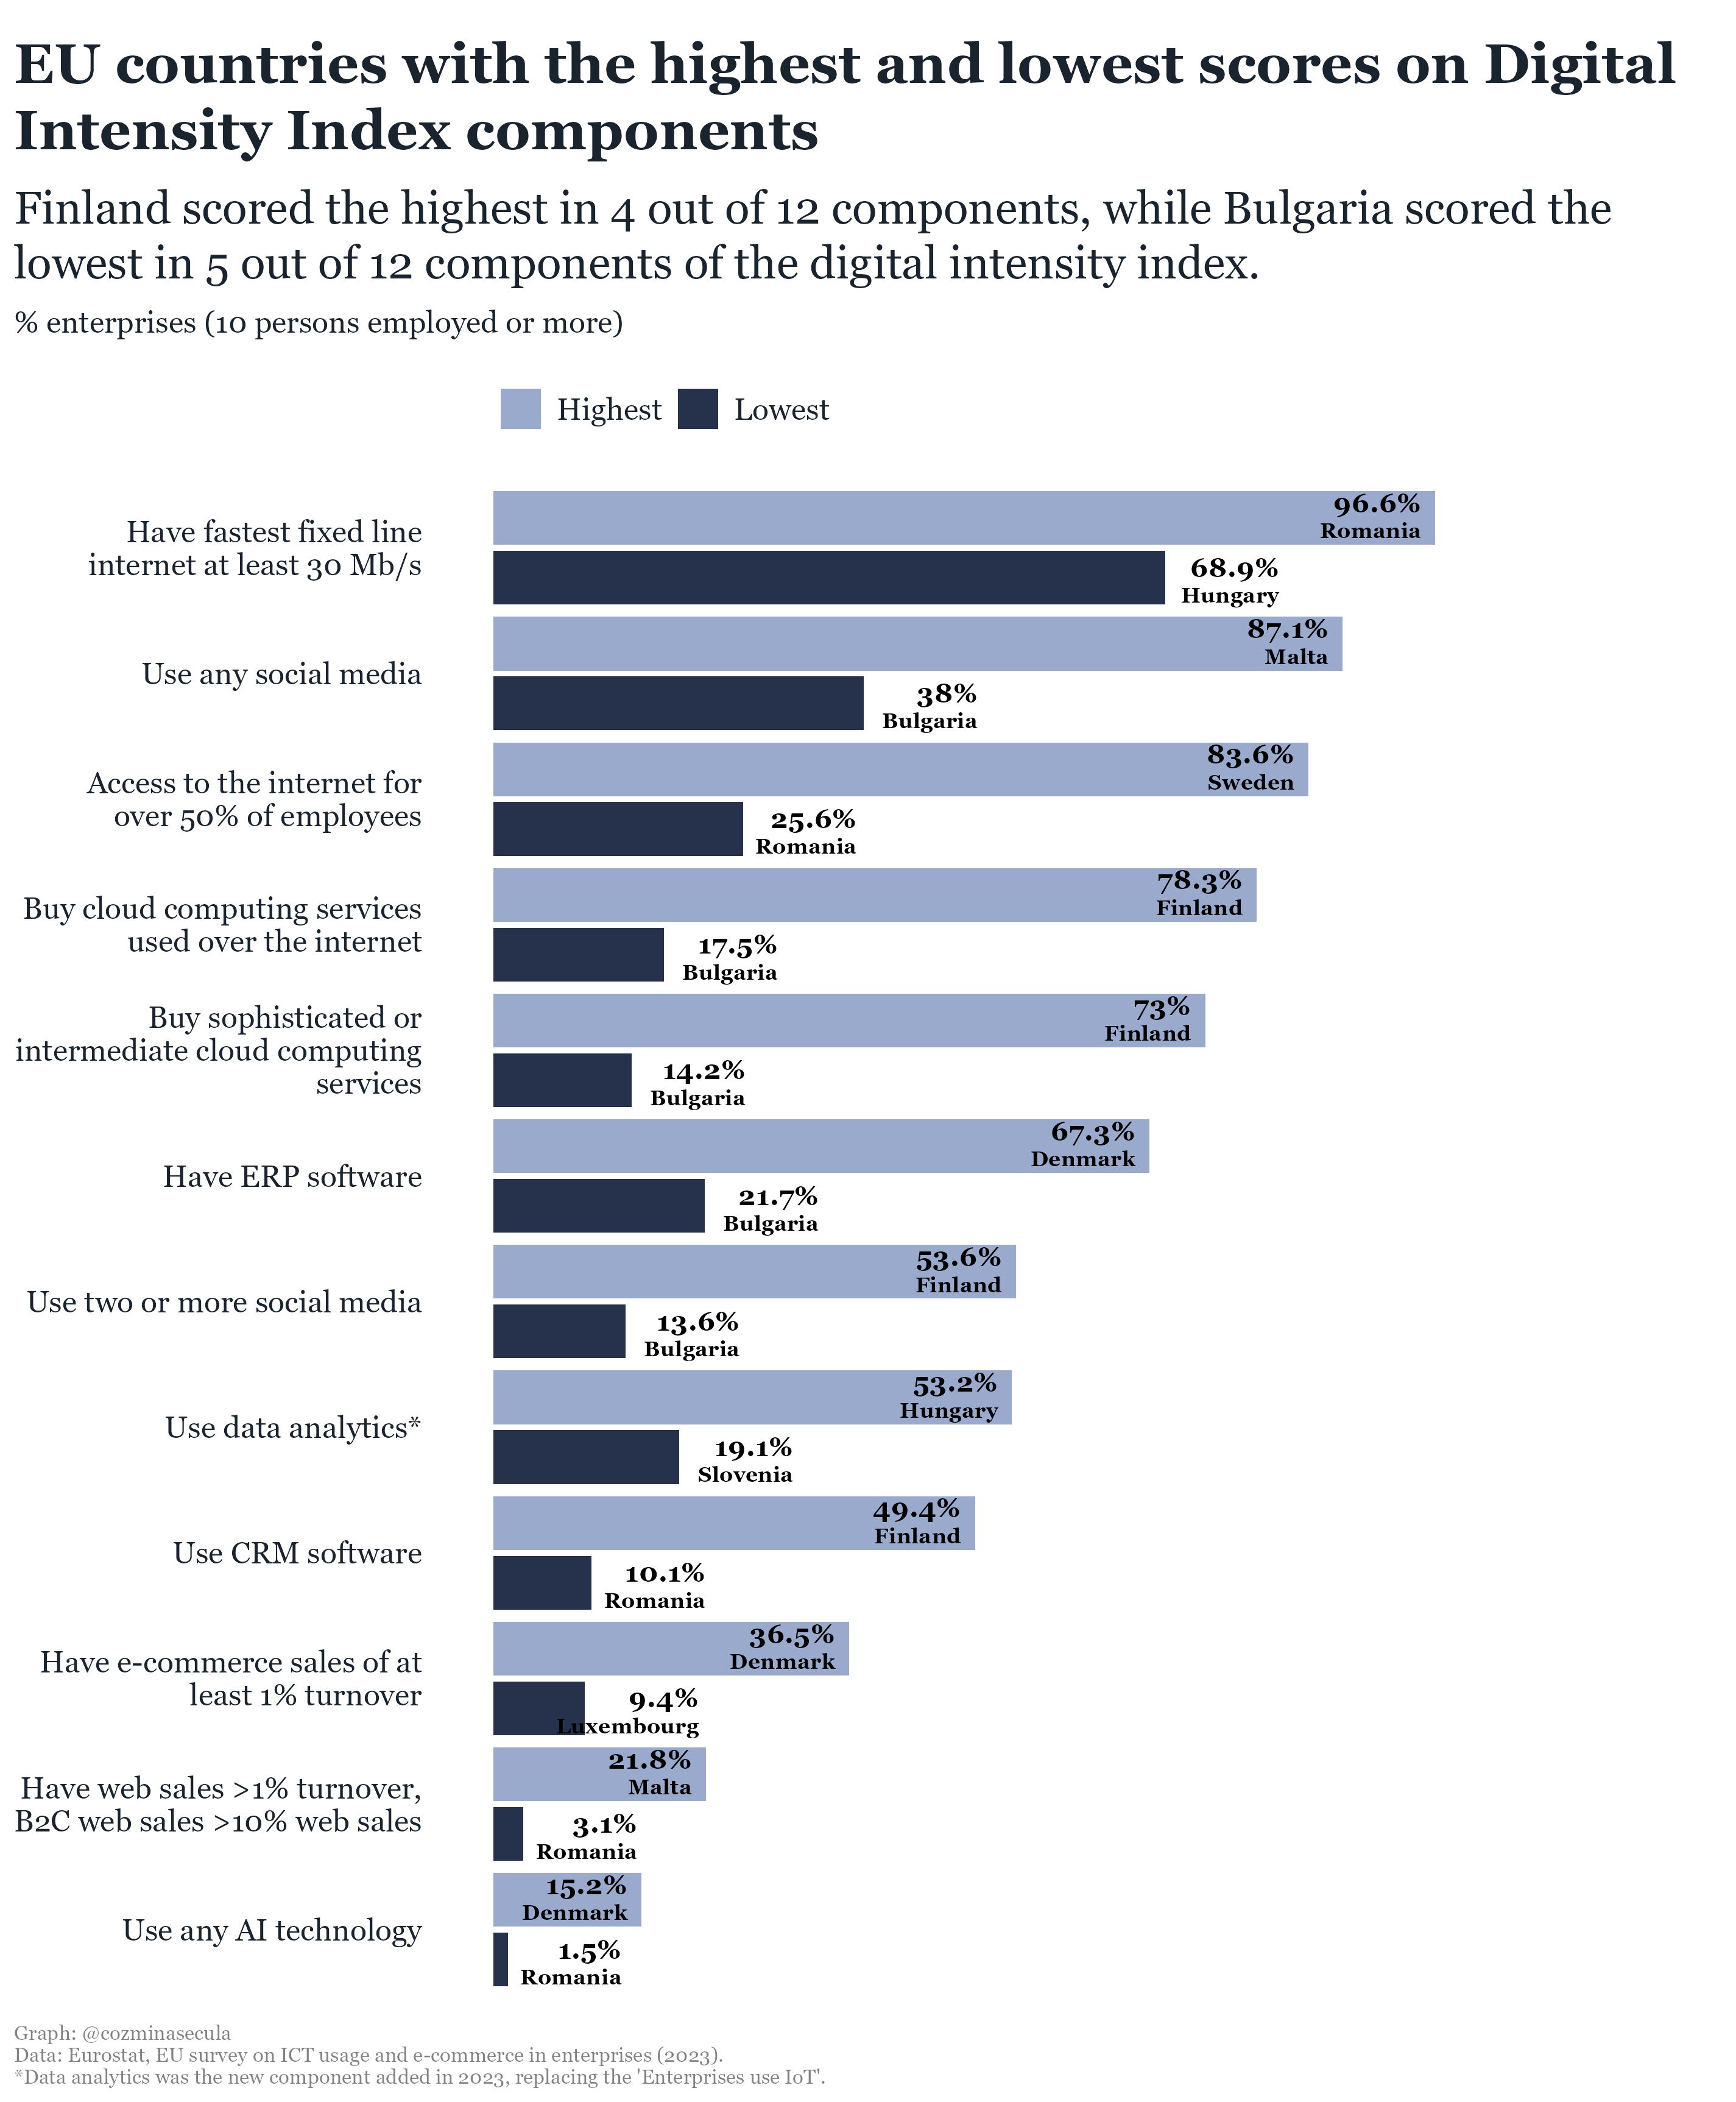
The components of EU’s Digital Intensity Index (DII) in 2023
data analysis
data visualization
eurostat
digital intensity index
Comparative Analysis of the EU’s Digital Intensity Index’s 12 components in 2023.
Jul 24, 2024
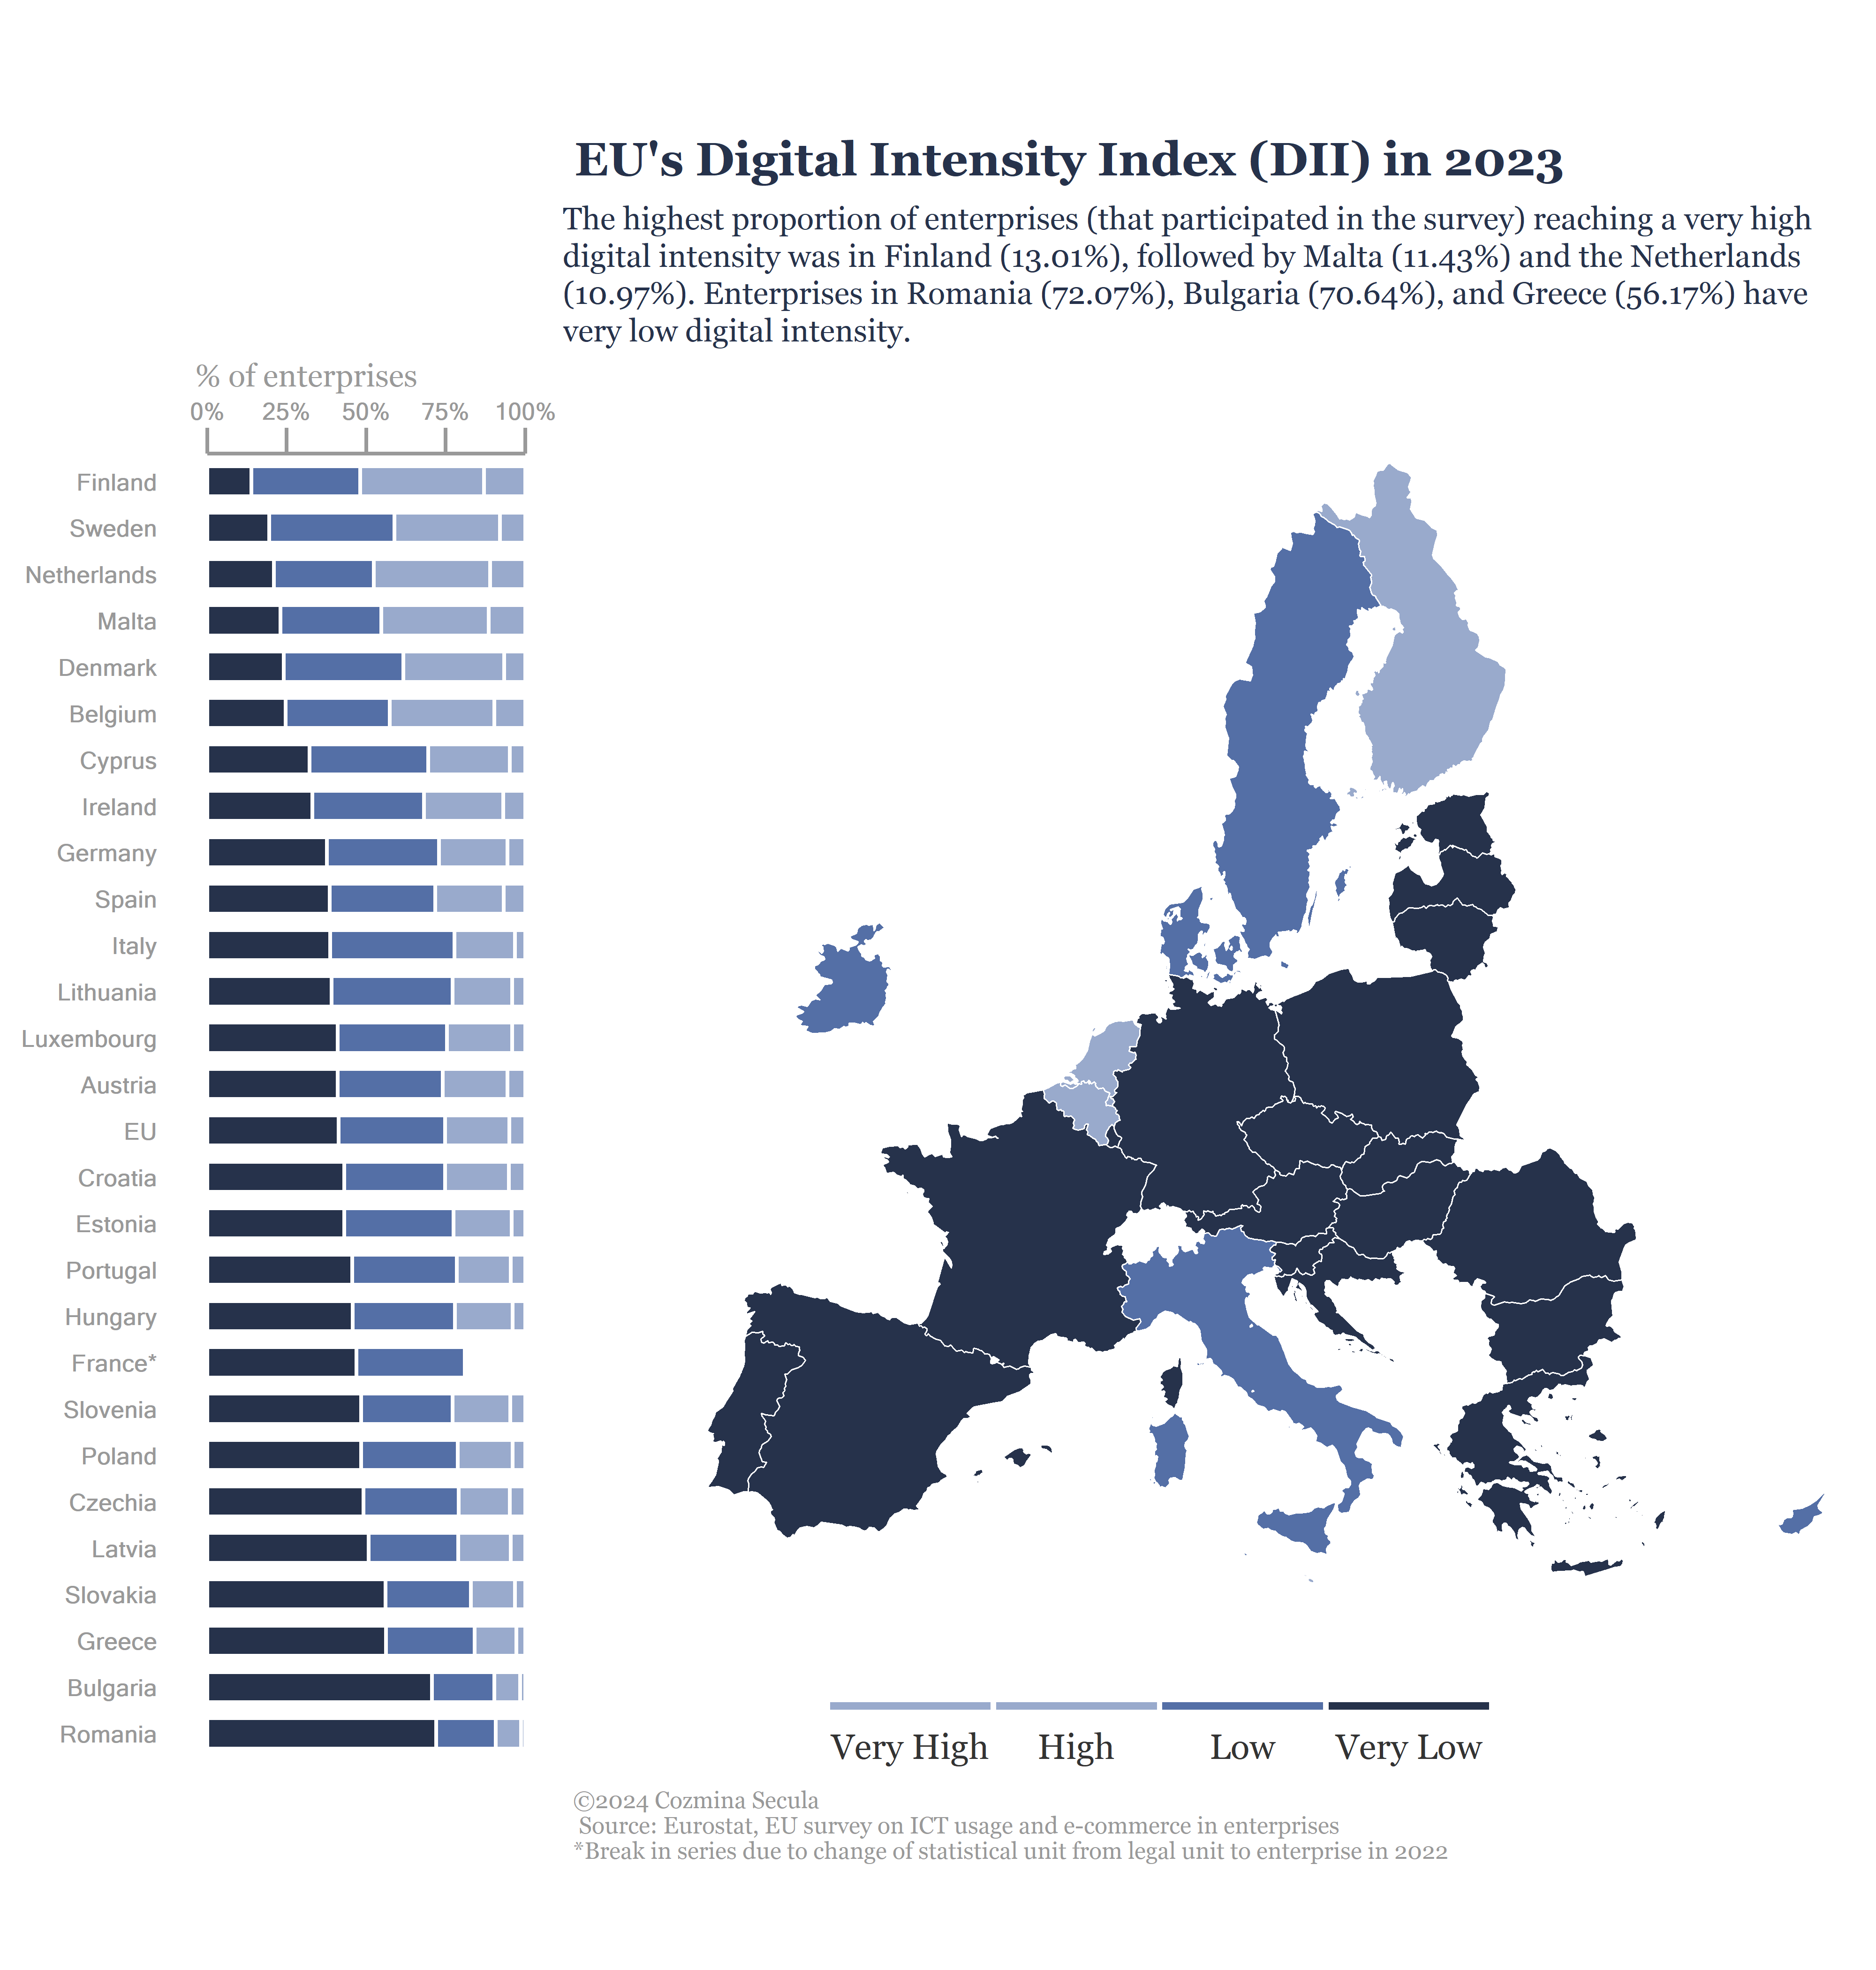
EU’s Digital Intensity Index (DII) in 2023
data analysis
data visualization
eurostat
digital intensity index
The level of digital intensity of EU enterprises. An analysis of data from the EU survey on ICT usage and e-commerce in enterprises provided by Eurostat, the Statistical…
Jul 15, 2024
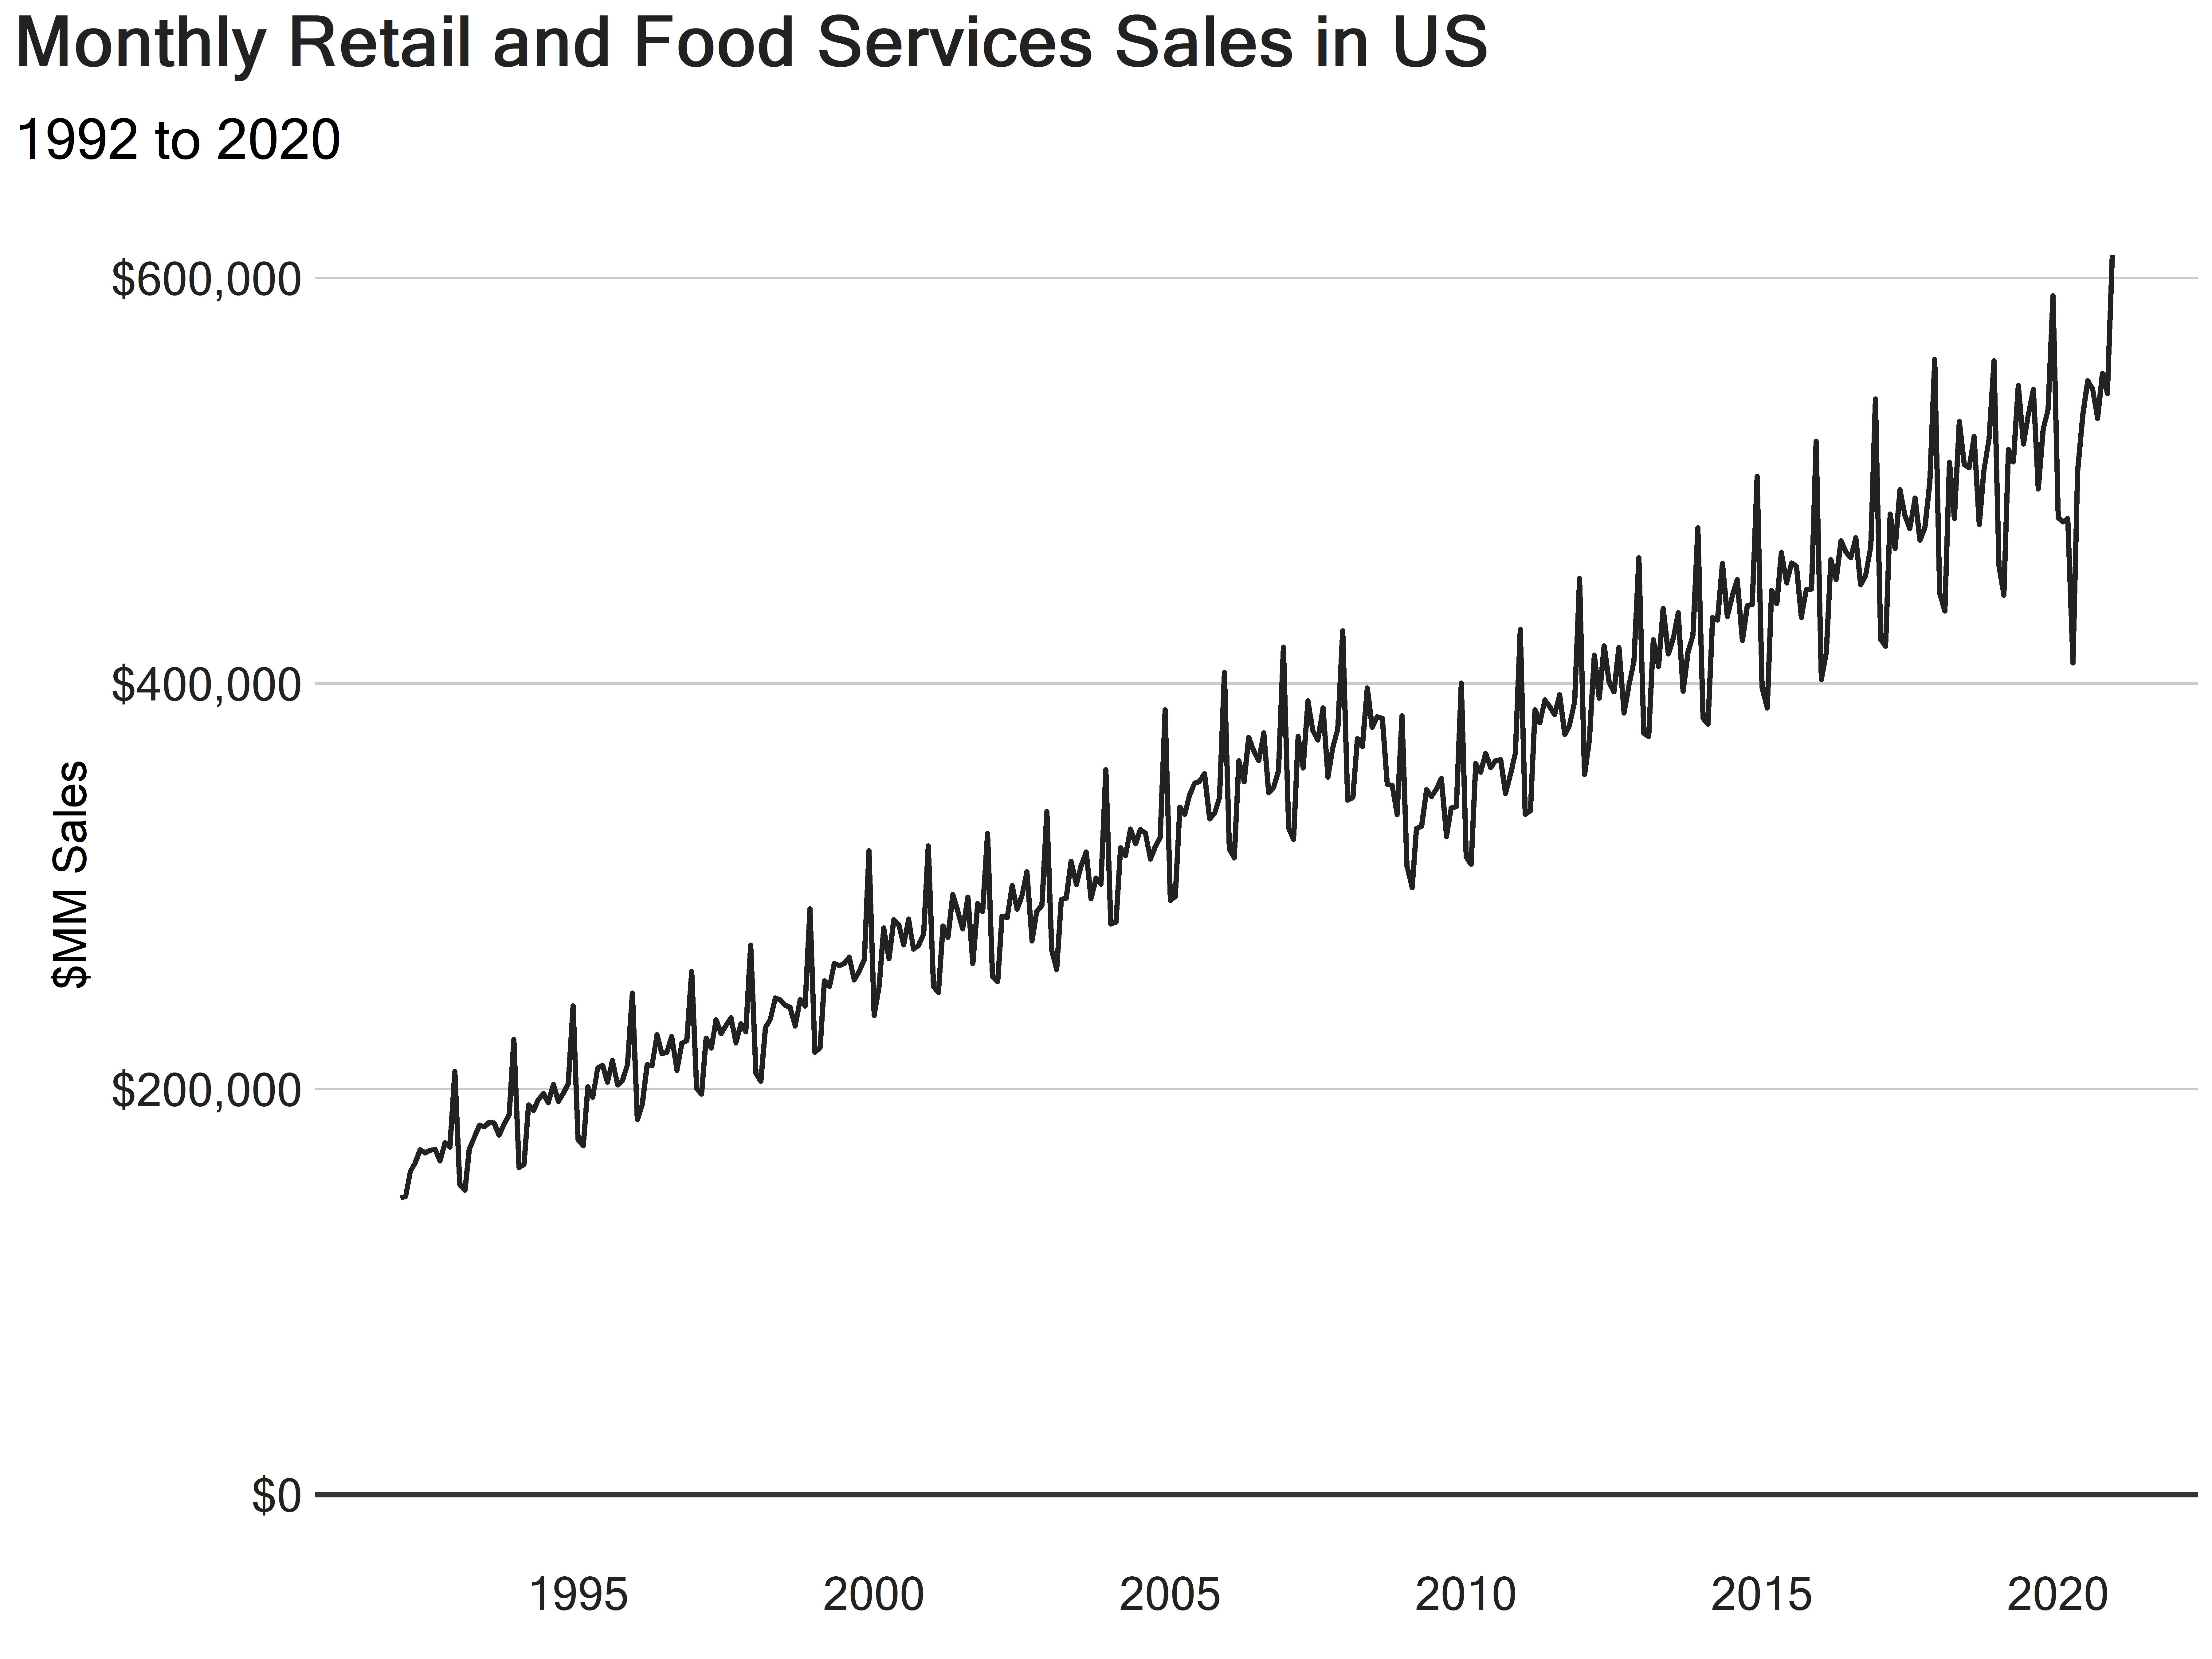
Time Series Analysis (Part I)
time series
trends
SQL
data analysis
data visualization
Analyzing time series data and looking for trends.
Jul 3, 2024
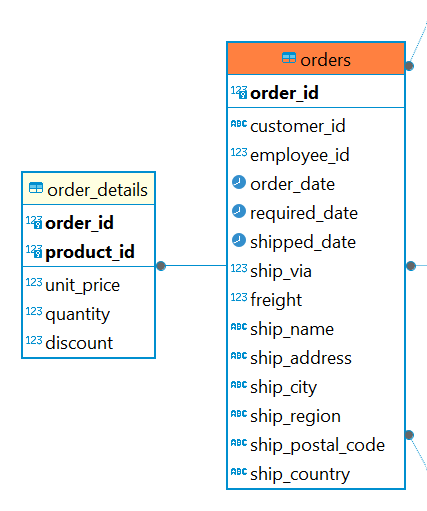
Analyzing Sales Revenue and Orders
SQL
data analysis
data visualization
sales data
Analyzing annual and monthly sales revenue and orders using data from the Northwind database.
Jun 26, 2024
Key Driver Analysis to understand customer loyalty in a financial organization (case study)
key driver analysis
data cleaning
data visualization
Analyzing a customer satisfaction survey to determine the most important factors influencing customer loyalty.
Jan 15, 2024
Creating a Dashboard with Quarto
dashboard
data visualization
Creating a customized dashboard with Quarto to visualize and present data.
Dec 5, 2023
Unlocking Insights (II): Analyzing Data with Summary Statistics and Independent Samples t-Test
summary statistics
t-test
quantitative analysis
Discover how to extract valuable insights from data using summary statistics and the independent samples t-test, with a case study on team diversity within a large…
Oct 11, 2023
Unlocking Insights (I): Analyzing Categorical Data with Cross-Table and Chi-Squared Test
cross-table
chi-squared test
quantitative analysis
Discover how to extract valuable insights from categorical data using cross-tables and the chi-squared test, with a case study on gender representation in senior roles.
Sep 14, 2023
Employees’ perception of well-being at work: A qualitative study
qualitative analysis
empirical study
well-being at work
An empirical study that explores how employees perceive the work environment factors and managers’ behaviors influencing their well-being at work.
Sep 12, 2023
No matching items
/dsi_change_table.png)
/dsi_eu_histogram.png)